How to Interpret Velocity Charts for Agile Project Reporting?
Short answer
D The project is trending ahead of schedule.
Question
Key Takeaways
Tests interpretation of planned versus actual velocity curves, with the common trap being misreading temporary early delays as negative performance instead of recognizing the overall upward trajectory.
This question tests your ability to analyze agile velocity charts and report project status accurately. The community consensus confirms that when actual completion outpaces the planned timeline, the project is trending ahead of schedule.
Common mistake: Option A is frequently chosen because candidates assume any initial delay must have consumed contingency reserves, but velocity charts track throughput over time rather than budget or reserve consumption.
Expert Analysis
Why the Answer Is Correct
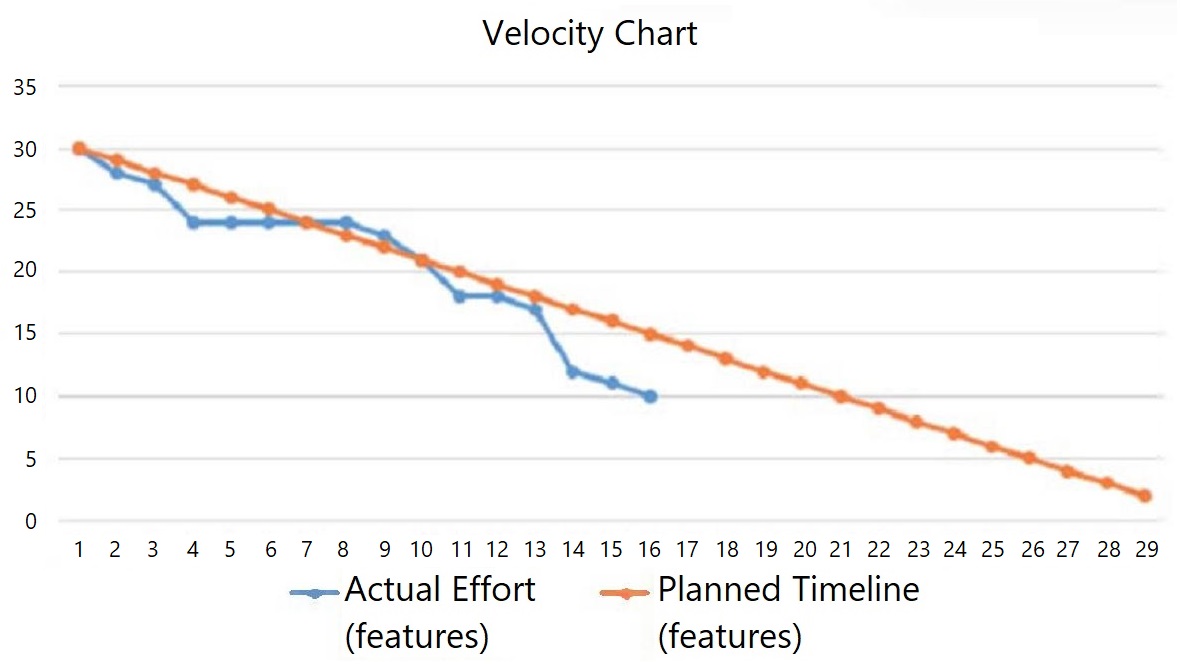
A velocity chart compares planned work completion against actual progress across iterations. In this scenario, the actual line rises above the planned baseline, indicating that the team is delivering more features per sprint than originally forecasted. This directly signals that the project is advancing faster than the baseline plan, making "trending ahead of schedule" the accurate status update for senior management.Why the Other Options Are Wrong
Option A incorrectly conflates schedule performance with financial or time reserves, which are not depicted on a velocity chart. Option B suggests scope creep, but velocity charts measure completed work volume, not uncontrolled feature additions. Option C references the critical path, a traditional waterfall concept that does not apply to iterative agile methodologies where work is prioritized dynamically.Community Comment Notes
Candidates consistently highlight that the actual line surpassing the planned line is the key visual cue for option D. One commenter notes that early delays do not negate the overall positive trajectory shown by the curve. Another emphasizes comparing the two lines directly to determine whether the team is accelerating or decelerating relative to expectations.Official Reference
These links open the official vendor documentation in a new tab.
Community Votes
100% of anonymous learners picked answer D. Votes are pick records left by other test-takers — they are not the verified answer.
Discussion 3 contributions
Compiled from public community threads and reader submissions, lightly edited for clarity. Handles and vote tallies are shown as recorded, and comments reflect the views of individual contributors.
From public community threads 3
-
BlueMan93 👍 3 Answered DThis chart is showing they completed (let's say) 10 tasks in (let's say) 16 days when they projected it would take 21 days to complete 10 tasks.
-
Therealjosh 👍 1 Answered DA velocity chart is a tool used in agile project management to track the progress and performance of a project team over time. It shows the number of features or user stories completed in each iteration or sprint. The planned timeline line represents the expected or ideal velocity, while the actual effort line shows the actual or achieved velocity. By comparing the two lines, the Scrum master can identify any gaps, trends, or issues in the project delivery. Based on the image, the most likely update that the Scrum master can provide to the senior management team isD. The project is trending ahead of schedule. This is because the actual effort line is above the planned timeline line for most of the time, indicating that the project team is completing more features than expected in each sprint. This means that the project is ahead of schedule and has a positive velocity variance
-
ducko 👍 1The only justification I can give for 'A' is that on day 8 and 9, the project was behind schedule and was trending that way. You could then assume that the PM utilized the reserve to reverse that trend. 'D' is correct for sure, the question is which one is 'more' correct.
Reader comments & corrections
No reader corrections yet — spotted an error or have a note? Share it below.
Related Analysis
Practice All PK0-005 Questions
Access 102 questions with complete answers and detailed explanations.
View Full PK0-005 Practice Test →