Diagnosing OOM Errors in Azure Databricks
Short answer
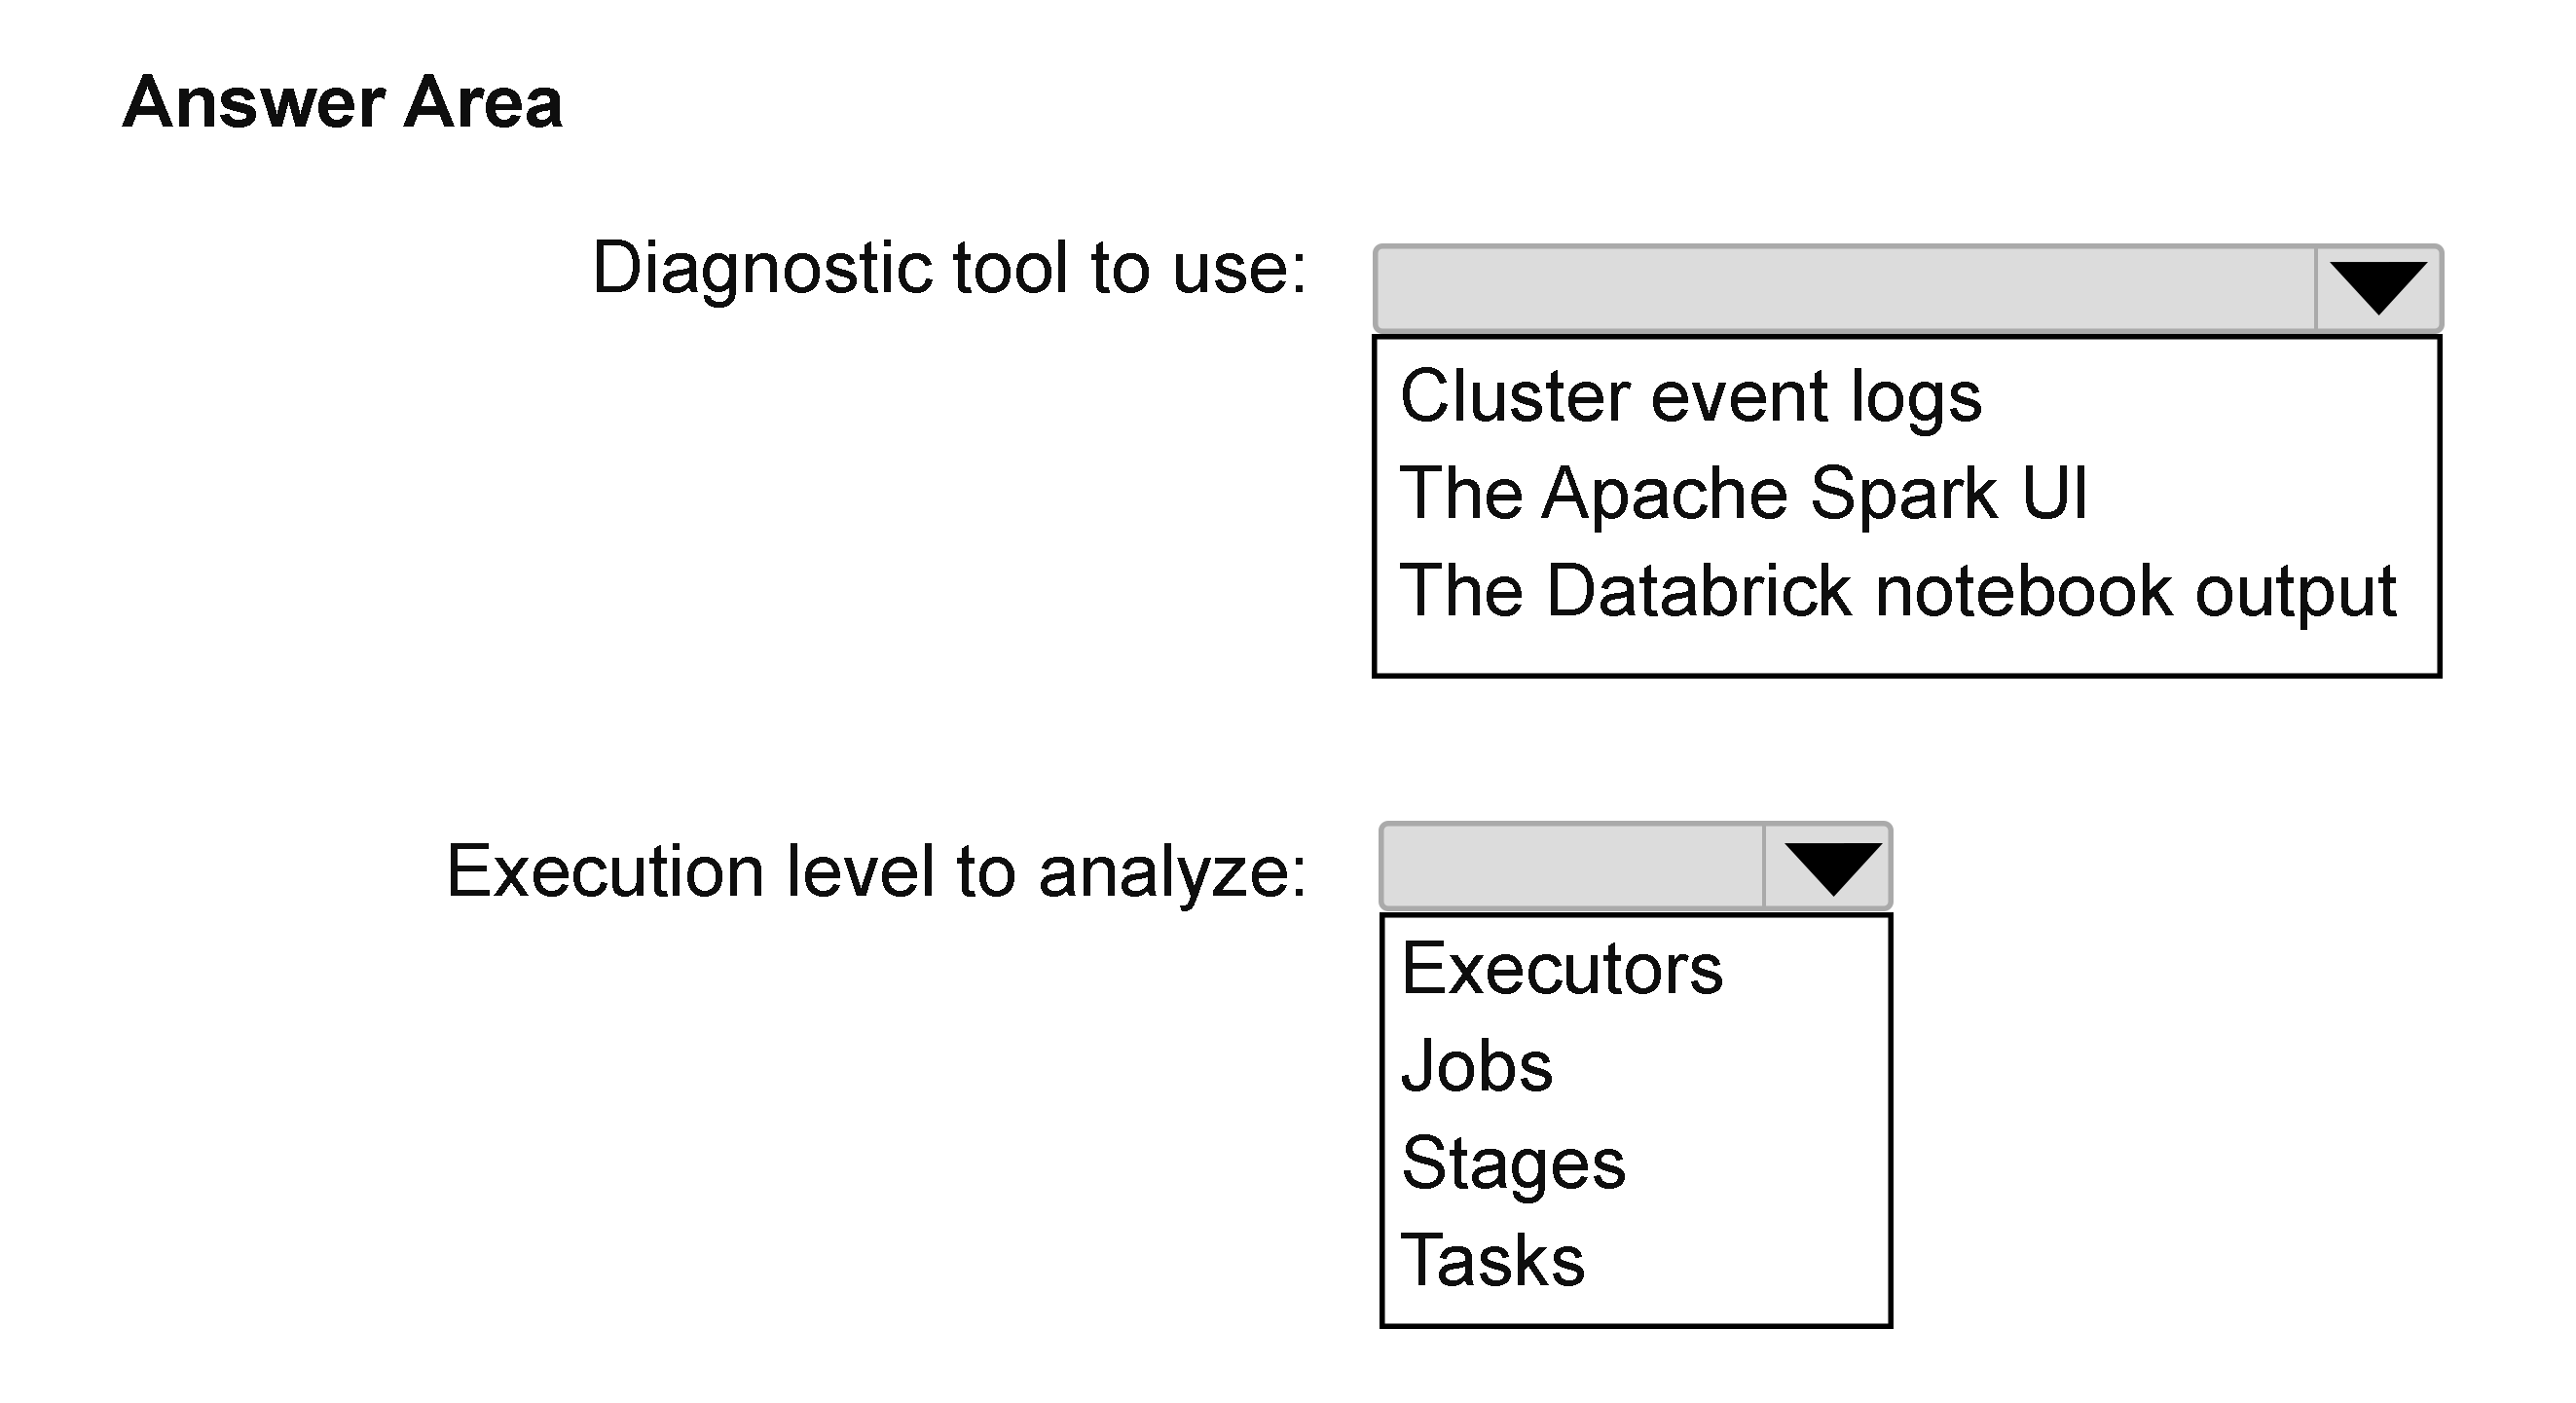
Analyze the runtime execution behavior at the Executor level using the Spark UI.
Question
You have an Azure Databricks workspace that contains an all-purpose cluster named Cluster1.
You discover that out-of-memory (OOM) errors intermittently cause jobs running on Cluster1 to fail.
You need to identify the root cause of the failures by analyzing the runtime execution behavior.
What should you do? To answer, select the appropriate options in the answer area.
NOTE: Each correct selection is worth one point.
Key Takeaways
OOM errors are executor-specific issues; therefore, diagnosis requires examining the Executor level in the Spark UI rather than the Driver level.
Learn how to diagnose intermittent out-of-memory errors in Azure Databricks by analyzing runtime execution at the Executor level using the Spark UI.
Common mistake: Selecting the Driver level or Cluster Logs. This fails because driver logs only confirm failure, while the driver itself rarely has enough memory to hold all task details needed to pinpoint the OOM cause.
Expert Analysis
To identify the root cause of intermittent out-of-memory (OOM) errors in Azure Databricks, you must analyze the runtime execution behavior at the Executor level using the Spark UI.
The Decision Logic:
- Level: Executor Level: OOM errors occur when a specific executor runs out of heap memory while processing a partition. Analyzing the driver alone only shows that jobs failed; analyzing executors reveals which tasks are consuming excessive memory.
- Tool: Spark UI: This is the primary diagnostic interface for Spark workloads. It allows you to view stage-level metrics, task durations, and memory usage per executor.
Why other approaches fail: Checking cluster logs might show an OOM exception, but it rarely explains why* a specific task consumed so much memory without drilling into the Spark UI's task details.
- Analyzing the Driver level does not provide granular memory usage data for individual partitions or tasks, which is essential for diagnosing OOM.
Adjacent Knowledge & Operational Impact: This scenario highlights the critical distinction between cluster configuration and runtime tuning. If you get this wrong, you may misdiagnose a data skew issue as a simple capacity problem. The operational consequence of ignoring executor-level analysis is repeated job failures despite increasing cluster size, because the underlying code inefficiency (e.g., loading too many rows into a single partition) remains unaddressed. To fix the root cause, you would typically use the Spark UI to identify skewed keys and apply techniques like salting or repartitioning.
Exam Strategy
When asked to diagnose Spark performance issues (OOM, slow stages), always select 'Spark UI' as the tool. Then, distinguish between Driver and Executor levels: choose 'Executor' for memory/CPU/per-task issues, and 'Driver' for orchestration/job submission issues. Memorize this mapping to quickly answer hotspot questions.
Frequently Asked Questions
What causes Out-of-Memory errors in Azure Databricks?
How do I access the Spark UI in Azure Databricks?
Discussion 3 contributions
Compiled from public community threads and reader submissions, lightly edited for clarity. Handles and vote tallies are shown as recorded, and comments reflect the views of individual contributors.
From public community threads 3
-
Abhi_007 👍 3Execution level to analyze: Tasks Copilot said: Because OOM (Out Of Memory) errors occur at the task/executor level, and the Spark UI lets you drill down to the exact task causing the memory pressure.
-
Frazer1 👍 2To identify the root cause of out-of-memory (OOM) errors in Azure Databricks, you should access and analyze the Spark UI and review the cluster's driver and executor logs.
-
mtc9 👍 1I would then say executor level, not task
Reader comments & corrections
No reader corrections yet — spotted an error or have a note? Share it below.