How Do You Scale Azure PostgreSQL for Vector Index Memory Pressure?
DRAG DROP
A recommendation system stores 3 million embeddings in Azure Database for PostgreSQL.
During peak hours, P95 similarity-query latency increases, and the cache hit ratio drops significantly.
You suspect that the vector index working set no longer fits in memory, resulting in more disk reads.
You need to scale server resources and validate the outcome.
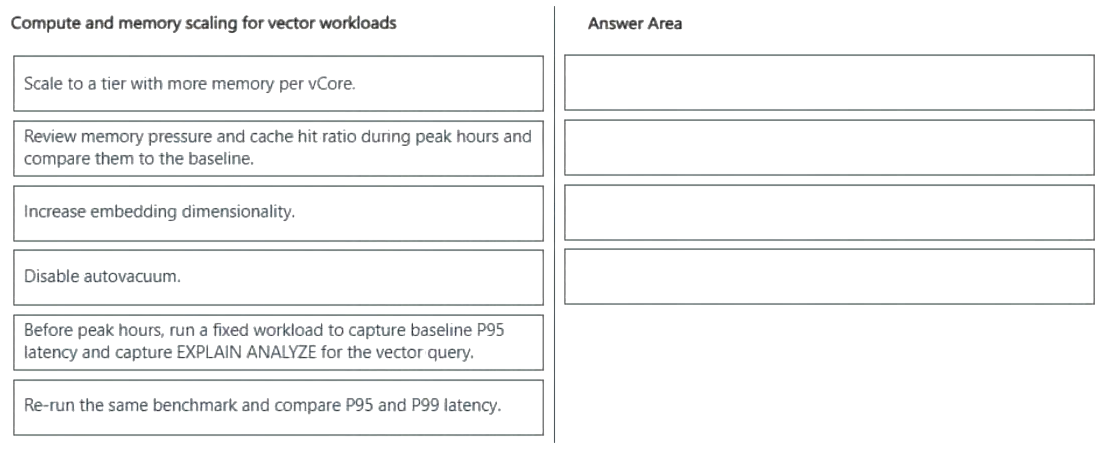
Which four actions should you perform in sequence? To answer, move the appropriate actions from the list of actions to the answer area and arrange them in the correct order.
Community Insight
It tests a measure–scale–validate loop for pgvector on Azure Database for PostgreSQL, and the trap is scaling to more vCores before capturing a baseline or re-running the same workload.
The question targets Azure Database for PostgreSQL with pgvector, where peak-hour P95 similarity-query latency rises as the vector index working set stops fitting in memory. The correct sequence baselines a fixed workload before peak, compares memory pressure and cache hit ratio during peak, scales to a tier with more memory per vCore, then repeats the identical benchmark for P95 and P99.
Many candidates scale the server first or only add vCores, which destroys the baseline and cannot prove that memory-per-vCore resolved the 3-million-embedding index's disk reads.
Community Discussion (2 comments)
Comments & Corrections
No comments yet — spotted an error or have a note? Share it below.
Expert Analysis
Why the Answer Is Correct
Peak-hour P95 latency rising while cache hit ratio falls points to the pgvector index working set exceeding available memory in Azure Database for PostgreSQL, so the sequence must start with an uncontaminated baseline. Capturing a fixed workload before peak with P95 latency and EXPLAIN ANALYZE gives a comparable performance and plan snapshot. During peak, reviewing memory pressure and cache hit ratio against that baseline confirms whether disk reads are driving the regression. Scaling to a tier with more memory per vCore directly addresses the working-set shortfall, and re-running the exact same benchmark with P95/P99 closes the loop.Why Other Candidate Answers Are Wrong
Sequences that scale first lose the pre-change evidence and cannot distinguish memory pressure from concurrent load, bad query plans, or cache eviction caused by other queries. Scaling only vCores without more memory per vCore does not enlarge the buffer cache enough for a 3-million-embedding index, and changing the vector index type or query shape mid-experiment invalidates the comparison. Benchmarking with a lighter or different workload after scaling can make P95 look better without proving the production peak is fixed. Likewise, checking cache hit ratio without a baseline leaves no reference for whether the drop is abnormal.Community Comment Notes
Ja13 and MrTeacher both describe the same four-step order, with Ja13 emphasizing "run a fixed workload to capture baseline P95 latency" before peak hours. MrTeacher's version explicitly pairs that baseline with reviewing memory pressure and cache hit ratio during peak, then scaling to a tier with more memory per vCore. Both close with "Re-run the same benchmark and compare P95 and P99 latency", which matches the validation step required by the question. The comments are consistent and do not introduce a competing sequence.Official Reference
Exam Strategy
For this drag-and-drop sequence, anchor the answer around one rule: capture the baseline before any scaling, then validate with the identical benchmark after scaling. Choose the tier change that adds memory per vCore, because the symptom is a vector index working set that no longer fits in memory.
Frequently Asked Questions
Why capture a pre-peak baseline before scaling Azure Database for PostgreSQL?
It records P95 latency and EXPLAIN ANALYZE for the same fixed workload, so later memory-pressure and cache-hit changes can be compared without peak-hour noise.
Does a higher memory-per-vCore tier fix a pgvector index that no longer fits in memory?
It can, because more memory per vCore enlarges the usable cache for the vector index; the identical P95/P99 benchmark proves whether disk reads actually fell.