Minimize Administrative Effort for Process and Network Data in Microsoft Defender
Short answer
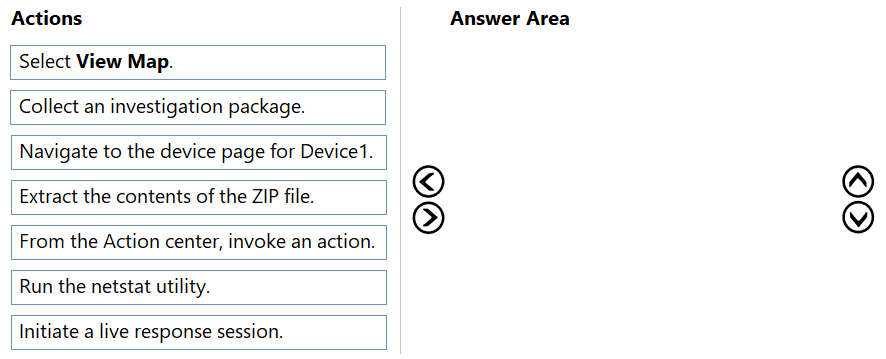
Navigate to the device page for Device1; Collect an investigation package; From the Action center, invoke an action; Extract the contents of the ZIP file
Question
You have an on-premises Windows 11 Pro device named Device1 that is onboarded to Microsoft Defender for Endpoint.
You have a Microsoft 365 subscription.
You need to identify the processes running on Device1 and which network connections the processes have open. The solution must minimize administrative effort.
Which four actions should you perform in the Microsoft Defender portal in sequence? To answer, move the appropriate actions from the list of actions to the answer area and arrange them in the correct order.
Key Takeaways
The key trap is choosing 'Live Response' for simple data gathering; the correct path uses the automated 'Investigation Package' feature to minimize effort.
Learn how to efficiently retrieve process and network connection data from a Windows 11 device using Microsoft Defender by collecting an investigation package instead of using manual live response commands.
Common mistake: Learners often select 'Initiate a live response session' followed by running 'netstat'. This fails the 'minimize administrative effort' constraint because it requires manual command entry, real-time monitoring, and manual analysis of raw text output, whereas the investigation package automates this collection and packaging.
Expert Analysis
The objective is to identify running processes and their open network connections on Device1 while minimizing administrative effort. In the Microsoft Defender portal, the most efficient method for this specific data retrieval is not a manual interactive Live Response session, but rather an automated background collection.
First, you must Navigate to the device page for Device1. This is the prerequisite context for any action taken against that specific endpoint. From here, the next step is to Collect an investigation package. This action triggers Microsoft Defender to automatically gather forensic artifacts, including process lists and network connection details (such as netstat output), into a single compressed file. This approach minimizes effort because it requires no command-line interaction or manual parsing.
Once the collection is complete, the system provides a link or button to download the artifact. The final step is to Extract the contents of the ZIP file. By extracting the archive, you can access the included reports and logs that explicitly list the processes and their associated network sockets.
Alternative approaches involving 'Initiate a live response session' are incorrect because they require manual execution of commands (like netstat or ps) and subsequent interpretation of raw console output, which increases administrative effort and complexity compared to the pre-packaged investigation package.
Official Reference
https://learn.microsoft.com/en-us/defender-endpoint/respond-machine-alerts
This link opens the official vendor documentation in a new tab.
Exam Strategy
When a question emphasizes 'minimizing administrative effort' or 'automated reporting' for forensic data like process lists, memory dumps, or logs, prioritize built-in collection features like 'Investigation Packages' over manual 'Live Response' sessions. Always check if the required data is available in standard pre-packaged artifacts before resorting to custom command scripts.
Frequently Asked Questions
Why is 'Collect an investigation package' better than 'Live Response'?
What does the investigation package contain?
Discussion 20 contributions
Compiled from public community threads and reader submissions, lightly edited for clarity. Handles and vote tallies are shown as recorded, and comments reflect the views of individual contributors.
From public community threads 20
-
G57 👍 9Navigate to the device page> collect investigation package>from the action center, invoke an action>extract the content of the zip file. I work with Defender on a daily basis and this is the way it's done.
-
DarthFrank 👍 7is it just me or is like 70% of the stuff on a public community thread just wrong and everyone on here having to correct it? I'm trying to navigate this as well and I'm still trying to figure out the correct sequence.
-
a_kto_to 👍 4Navigate to the device page for Device1 Collect and investigation package From the Action center, invoke an action Extract the contents of the ZIP file here link: https://learn.microsoft.com/en-us/defender-endpoint/respond-machine-alerts
-
G57 👍 3Why run a live response session if you need to download the investigation package?
-
JNGuru 👍 3Source: Trust me bro
Show 15 more comments
-
Optimizor_IT 👍 2Navigate to the device page for Device1 Initiate a live response session From the Action center, invoke an action (run ps and net) Collect an investigation package (optional, for records, though not needed for live data)
-
JustLooking50 👍 2navigate to device in Defender collect investigation package Action centre and invoke action, download the package basically Extract contend from zipped package
-
nick34567 👍 2Navigate to the device page for Device1. Collect an investigation package. From the Action center, invoke an action. Extract the contents of the ZIP file.
-
rkrau 👍 2I go with Navigate to the device page for Device1 Initiate a live response session Collect and investigation package Extract the contents of the ZIP file
-
54c341a 👍 1The first step as initiate live response session doesn't make sense. Initiating a live response session does nothing without then running commands. None of them really fit but the closest I think would be 'From the Action centre, invoke an action, with the action being collect an investigation package. Navigate to the device page for Device1 From the Action center, invoke an action Collect and investigation package Extract the contents of the ZIP file
-
Openbpo 👍 1Navigate & Collect investigation package & from action invokee an action & Extract , read the doc https://learn.microsoft.com/en-us/defender-endpoint/respond-machine-alerts https://learn.microsoft.com/en-us/defender-endpoint/respond-machine-alerts
-
Djonzi 👍 11️⃣ Navigate to the device page for Device1. 2️⃣ Initiate a live response session. 3️⃣ Run the netstat utility. 4️⃣ From the Action center, invoke an action. The netstat command can show which processes have network connections.
-
ca5baba 👍 1To get live running processes and their open network connections and as per ChatGPT 1. Navigate to Device for Device1 Page 2. Initiate a Live Response session 3. Run the netstat utility 4. Select view Map.
-
rishiraval007 👍 1Agree with the Answer. Navigate to the device page for Device1 > Collect an investigation package > From the Action center, invoke an action > Extract the contents of the ZIP file
-
cbdfbaf 👍 1Nope, collecting an investigation package is a direct action available on the device page and does not strictly require you to manually initiate a live response session first
-
Charles_2002 👍 1Navigate to Endpoints > Device inventory and select a device to investigate. The devices page opens first https://learn.microsoft.com/en-us/defender-endpoint/live-response
-
Krayzr 👍 1Don't you have to INITIATE LIVE RESPONSE SESSION ? https://learn.microsoft.com/en-us/defender-endpoint/respond-machine-alerts#initiate-live-response-session
-
d9b53a0 👍 1The correct order is: Navigate to the device page for Device1 Select View Map. From the Action center, invoke an action. Initiate a live response session.
-
8f991ac 👍 1- Navigate to the device page for Device1 - Initiate a live response session - Run the netstat utility - From the Action center, invoke an action
-
Optimizor_IT 👍 1And your answer to the question is?
Reader comments & corrections
No reader corrections yet — spotted an error or have a note? Share it below.
Related Analysis
Practice All SC-200 Questions
Access 80 questions with complete answers and detailed explanations.
View Full SC-200 Practice Test →