Identifying Analytics Types from Fabric Notebook Code
You have a Fabric notebook that has the Python code and output shown in the following exhibit. Which type of analytics are you performing? - 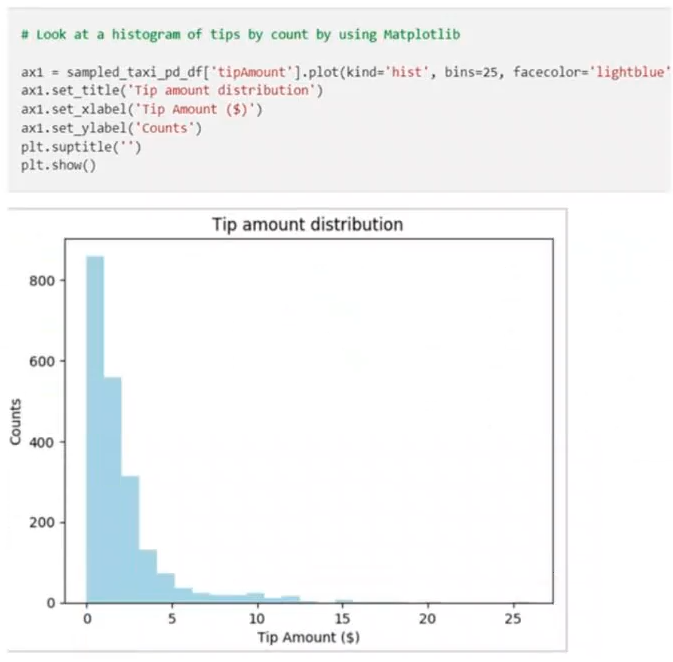
Community Votes
100% of anonymous learners picked answer A. Votes are pick records left by other test-takers — they are not the verified answer.
Community Insight
The core concept is recognizing that summarizing or visualizing past events (What happened?) is descriptive analytics, while the common trap is confusing it with diagnostic (Why it happened) due to over-analyzing the chart type.
This question tests the ability to distinguish between descriptive, diagnostic, prescriptive, and predictive analytics based on code output. It establishes that visualizing historical data distributions corresponds to descriptive analytics.
Most learners incorrectly select Diagnostic because they assume analyzing a distribution requires understanding causes, but the code simply displays the data state.
Community Discussion (3 comments)
Comments & Corrections
No comments yet — spotted an error or have a note? Share it below.
Expert Analysis
Why the Answer Is Correct
The correct answer is A (descriptive). The provided exhibit shows Python code using Pandas to generate a histogram of the 'Age' column. Descriptive analytics focuses on summarizing historical data to understand what has happened in the past. By creating a frequency distribution (histogram), the code is describing the current state or distribution of the data without inferring causes or predicting future values.Why the Other Options Are Wrong
Option B (diagnostic) is incorrect because diagnostic analytics seeks to determine why something happened, typically involving drill-downs or root cause analysis rather than simple distribution visualization. Option C (prescriptive) is wrong as it recommends actions (e.g., optimization models), which this code does not do. Option D (predictive) is incorrect because predictive analytics uses statistical models to forecast future outcomes, whereas this code only analyzes existing data.Community Comment Notes
Community consensus strongly supports option A, with users noting the visual nature of the output aligns with classic descriptive statistics. One user highlighted that this approach answers the question "What is happening?" which is the hallmark of descriptive analytics. Another comment reinforced that the visual representation of age distribution is a standard example of descriptive analysis.Official Reference
Exam Strategy
When identifying analytics types, look for keywords: 'Summarize/Visualize' implies Descriptive; 'Drill-down/Cause' implies Diagnostic; 'Forecast/Predict' implies Predictive; and 'Optimize/Recommend' implies Prescriptive. Always map the code's action to these definitions.
Frequently Asked Questions
How do I distinguish descriptive from diagnostic analytics?
Descriptive analytics summarizes what happened (e.g., histograms), while diagnostic analytics investigates why it happened (e.g., correlation analysis).
Is a histogram considered predictive analytics?
No, a histogram describes the current or past distribution of data. Predictive analytics would use this data to forecast future trends.
Related Analysis
Practice All DP-600 Questions
Access 115 questions with complete answers and detailed explanations.
View Full DP-600 Practice Test →