Selecting Visualizations for Geographic, Categorical, and Temporal Data
Short answer
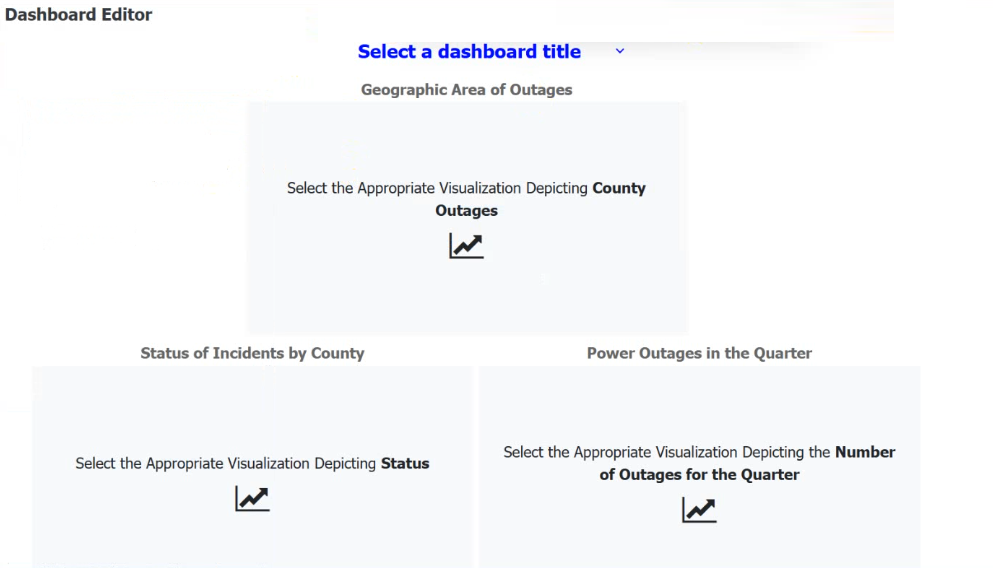
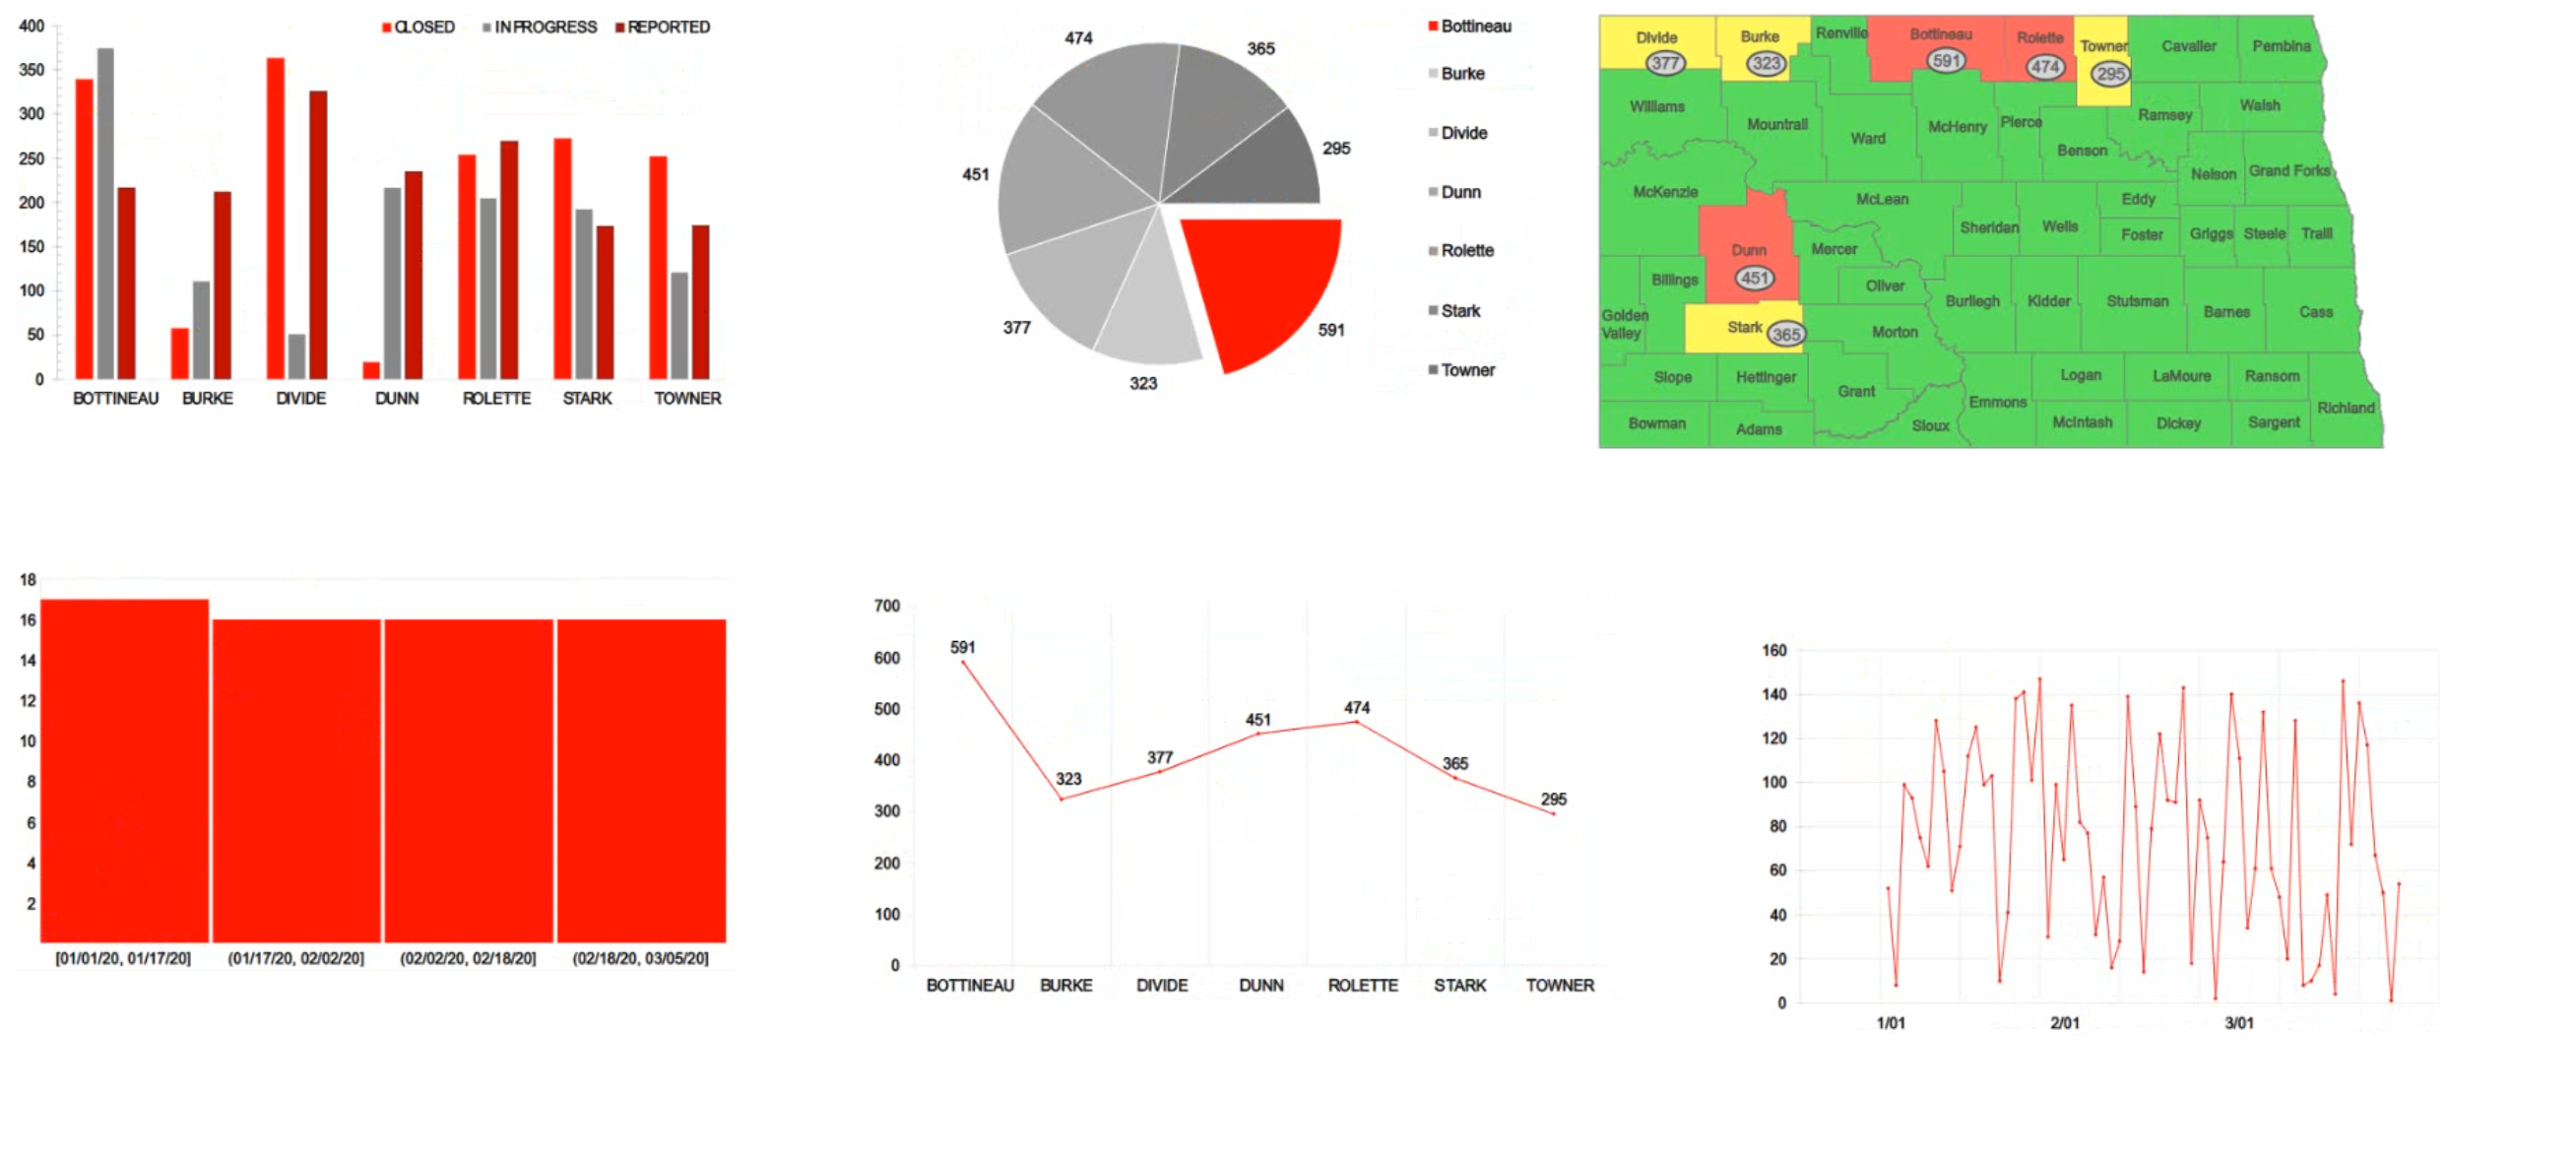
Use a Map chart for 'County outages' with no standard X/Y axis labels; use a Bar/Column chart for 'Status' with X-Axis as County and Y-Axis as Number of Outages; use a Line chart for 'Trend' with X-Axis as Date and Y-Axis as Number of Outages.
Question
The director of operations at a power company needs data to help identify where company resources should be allocated in order to monitor activity for outages and restoration of power in the entire state. Specifically, the director wants to see the following:
County outages
Status
Overall trend of outages
INSTRUCTIONS
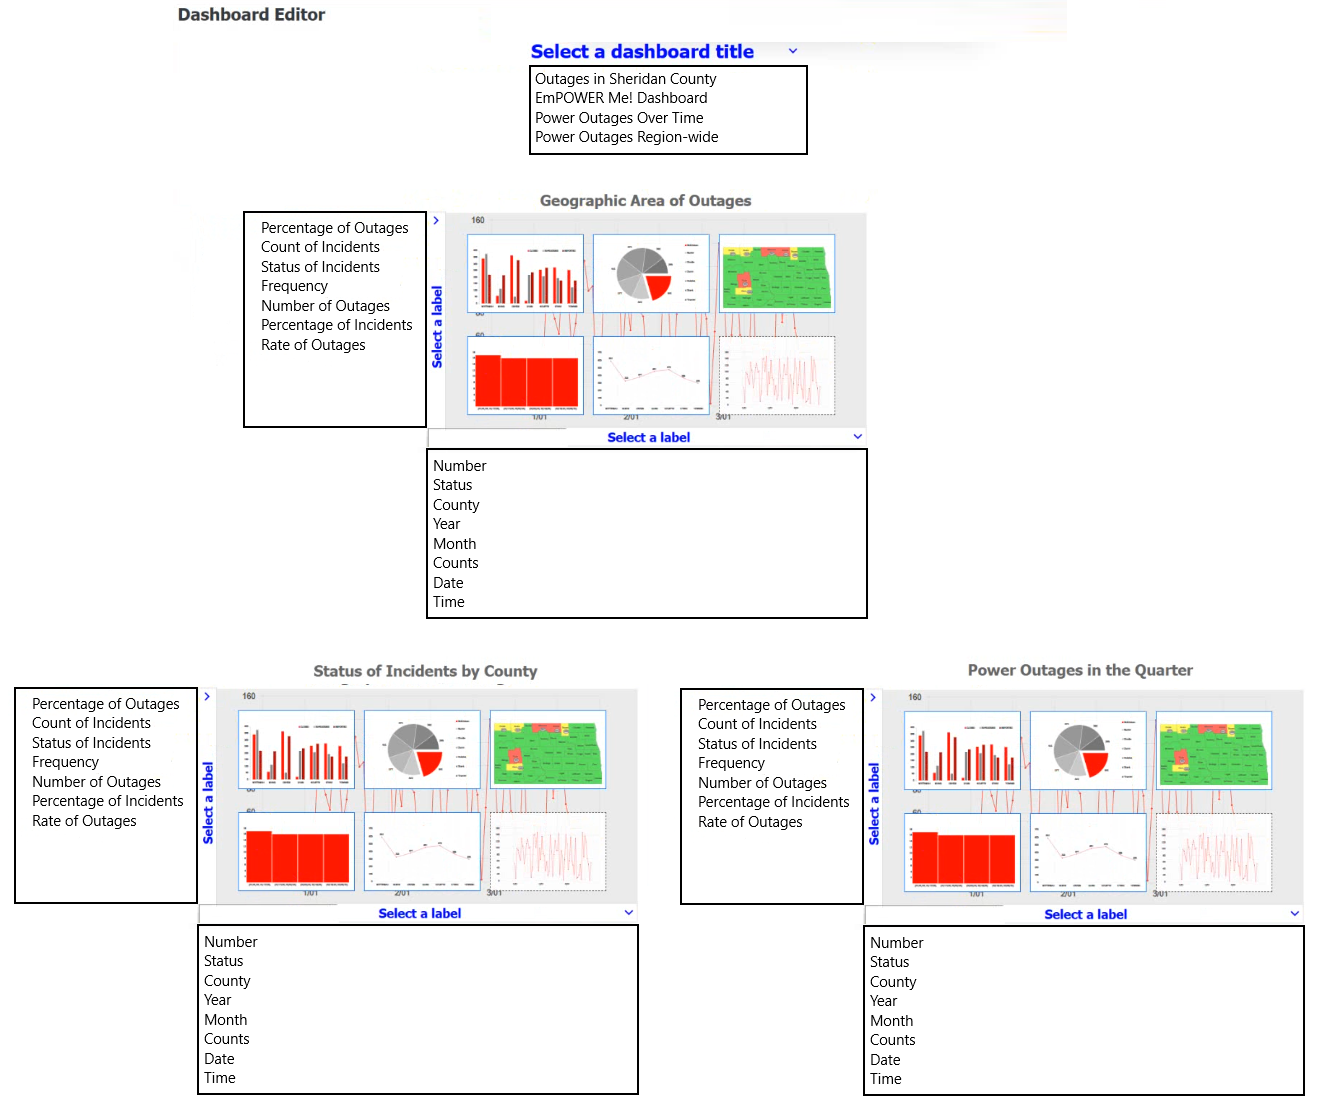
select each visualization to fit the appropriate space on the dashboard. Once you have selected all visualizations, use the drop-down menus to select the appropriate dashboard titles and axis labels, if applicable.
If at any time you would like to bring back the initial state of the simulation, please click the Reset All button.
Key Takeaways
The main trap is misidentifying the data type: geographic data needs a map, categorical comparisons need bars, and time-series trends need lines.
This page explains how to select the correct visualization type—Map, Bar Chart, and Line Chart—for geographic, categorical, and temporal data respectively in a Power BI dashboard scenario.
Common mistake: Learners often incorrectly assign a Pie Chart to 'Status' because it shows parts of a whole, but a Bar Chart is better for comparing counts across multiple counties. Another mistake is using a Scatter Plot for trends, which is for correlation, not time-series.
Expert Analysis
The scenario requires mapping three specific data requirements to appropriate visualization types and dashboard configurations. The core concept tested is Data Visualization Selection (Objective 4.1), specifically distinguishing between spatial, categorical, and temporal data representations.
First, the requirement for "County outages" implies a need to show geographic distribution. A Map chart is the correct choice here, as it plots data points on a geographic area. The dashboard title should reflect this scope, such as "Power Outages Region-wide," and since maps do not use traditional X/Y axes in the same way bar charts do, axis labels are typically omitted or handled via legend/tooltip context rather than explicit axis titles.
Second, the requirement for "Status" involves comparing discrete categories (e.g., Outage, Restored, Investigating) across different counties. A Bar chart or Column chart is ideal for comparing values across categorical dimensions. The dashboard title would be "Status of Incidents by County." The X-axis represents the categories (County), and the Y-axis represents the measure (Number of Outages or Status Count).
Third, the requirement for "Overall trend of outages" over time necessitates a Line chart or Area chart, which are designed to show changes and trends over a continuous period (Date). The dashboard title could be "Power Outages in the Quarter." The X-axis must represent Time (Date), and the Y-axis represents the metric (Number of Outages).
Comments from learners confirm this mapping: they identify the map for geographic area, the bar/column chart for county status comparison, and the line chart for date-based trends. The key trap is confusing the axis labels or choosing a pie chart for status (which doesn't compare magnitudes well across many counties) or a scatter plot for trends.
Exam Strategy
Always classify your data dimension first: Is it Spatial (use Map), Categorical/Discrete (use Bar/Column), or Temporal/Continuous (use Line/Area). Then match the chart to the analytical goal: location (Map), comparison (Bar), or trend (Line). Avoid Pie Charts for complex categorical comparisons.
Frequently Asked Questions
Why not use a Pie Chart for outage status?
What if the trend data is not daily?
Discussion 1 contributions
Compiled from public community threads and reader submissions, lightly edited for clarity. Handles and vote tallies are shown as recorded, and comments reflect the views of individual contributors.
From public community threads 1
-
6b7911d 👍 1So everyone has a simplified view: In this format: TAB:E NAME - X Axis: ANSWER, Y Axis: ANSWER Dashboard Title - Power Outages Region-wide Geographic Area of Outages - X Axis: County, Y Axis: Number of Outages Status of Incidents by County - X Axis: County, Y Axis: Status of Incidents Power Outages in the Quarter - X Axis: Date, Y Axis: Number of Outages
Reader comments & corrections
No reader corrections yet — spotted an error or have a note? Share it below.
Related Analysis
Practice All DA0-002 Questions
Access 100 questions with complete answers and detailed explanations.
View Full DA0-002 Practice Test →