Azure VM Insights: Map vs Performance Detail
Short answer
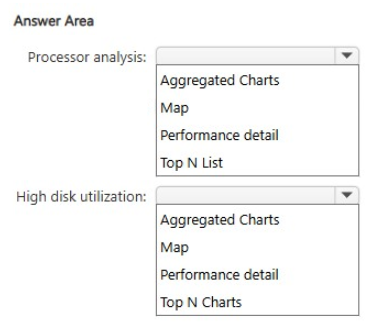
For identifying VMs with highest processor utilization, use Map. For identifying the specific process causing high disk utilization on one VM, use Performance detail.
Question
You have an Azure subscription. The subscription contains 120 virtual machines that run Windows Server and have VM insights enabled.
A nightly workload causes intermittent processor and storage performance incidents.
You need to investigate the incidents by using VM insights. The solution must meet the following requirements:
• Identify which virtual machines have the highest processor utilization.
• Identify which process on one virtual machine is causing high disk utilization.
What should you use for each requirement? To answer, select the appropriate options in the answer area.
NOTE: Each correct selection is worth one point.
Key Takeaways
Map provides high-level, cross-VM topology and CPU comparison, while Performance detail offers deep, process-level storage and CPU breakdowns for individual VMs.
Determine whether to use the VM Insights Map or Performance detail view to diagnose Azure Windows Server VM performance issues based on the scope of investigation.
Common mistake: Learners often confuse the two views, attempting to use Map to identify specific disk-intensive processes. Map lacks process-level granularity and only shows network connection topology, making it impossible to attribute disk I/O to a specific application.
Expert Analysis
The scenario involves troubleshooting intermittent performance incidents in Windows Server VMs using Azure VM Insights. The core challenge is distinguishing between the two primary data views available within the VM Insights interface: Map and Performance detail.
For the first requirement, identifying which virtual machines have the highest processor utilization, you must look at aggregate metrics across multiple resources. The Map view provides a high-level topology of your infrastructure, displaying real-time health status and key performance counters (such as CPU utilization) for each node. This allows for quick identification of hotspots among the 120 VMs. In contrast, Performance detail is focused on specific resource breakdowns rather than broad comparative visualization.
For the second requirement, identifying the specific process causing high disk utilization on a single VM, you need granular, process-level telemetry. The Performance detail view dives into the OS layer, showing detailed metrics for IOPS, throughput, and latency, and crucially, it breaks down these metrics by individual processes. As noted in learner comments, Map only visualizes network connections and cannot measure or attribute disk I/O to specific processes. Therefore, Performance detail is the only tool capable of linking high disk usage to a specific application thread or executable.
The boundary here is between macro-infrastructure visibility (Map) and micro-process visibility (Performance detail). VM Insights aggregates agent-collected data to provide both, but they serve distinct diagnostic purposes.
Official Reference
https://learn.microsoft.com/en-us/azure/virtual-machines/insights-virtual-machines
This link opens the official vendor documentation in a new tab.
Exam Strategy
When facing HOTSPOT questions about Azure monitoring tools, always ask if the requirement is 'comparative/topological' or 'granular/process-specific'. Use map-based views for spotting outliers across many nodes, and detail/performance views for drilling into what is consuming resources inside a single node.
Frequently Asked Questions
Can VM Insights Map show disk IOPS per process?
What data sources does VM Insights rely on?
Discussion 1 contributions
Compiled from public community threads and reader submissions, lightly edited for clarity. Handles and vote tallies are shown as recorded, and comments reflect the views of individual contributors.
From public community threads 1
-
linux_admin 👍 1High Disk Utilization: Performance detail is the correct answer because it directly tracks storage subsystem metrics (IOPS, throughput, and disk latency) to analyze disk bottlenecks, whereas Map only visualizes processes with active network connections and cannot measure disk I/O.
Reader comments & corrections
No reader corrections yet — spotted an error or have a note? Share it below.
Related Analysis
Practice All AZ-802 Questions
Access 125 questions with complete answers and detailed explanations.
View Full AZ-802 Practice Test →