Test PL-300
Question 1:You use Power Query to import two tables named Order Header and Order Details from an Azure SQL database. The Order Header table relates to the Order Details table by using a column named Order ID in each table.
You need to combine the tables into a single query that contains the unique columns of each table.
What should you select in Power Query Editor?
A.
Merge queries
B.
Combine files
C.
Append queries
Question 2:
You have a CSV file that contains user complaints. The file contains a column named Logged. Logged contains the date and time each complaint occurred. The data in Logged is in the following format: 2018-12-31 at 08:59.
You need to be able to analyze the complaints by the logged date and use a built-in date hierarchy.
What should you do?
A.
Apply the Parse function from the Data transformations options to the Logged column.
B.
Change the data type of the Logged column to Date.
C.
Split the Logged column by using at as the delimiter.
D.
Create a column by example that starts with 2018-12-31.
Question 3:
You have a Power BI data model that contains two tables named Sales and Date. The Sales table contains three measures named Order Quantity, Product Cost, and Sales Amount.
You need to create the visual shown in the following exhibit.
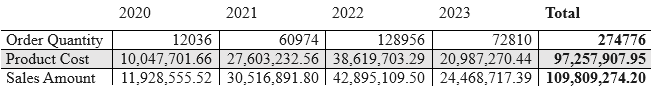
In which section of the Fields well should you place the measures?
A.
Columns
B.
Rows
C.
Values
D.
Drill through
Question 4:
You need to create relationships to meet the reporting requirements of the customer service department.
What should you create?
A.
a one-to-many relationship from Date[date_id] to Sales[sales_date_id] and another one-to-many relationship from Date[date_id] to Weekly_Returns[week_id]
B.
a one-to-many relationship from Sales[sales_date_id] to Date[date_id] and a one-to-many relationship from Sales[sales_ship_date_id] to Date[date_id]
C.
an additional date table named ShipDate, a many-to-many relationship from Sales[sales_date_id] to Date[date_id], and a many-to-many relationship from Sales[sales_ship_date_id] to ShipDate[date_id]
D.
an additional date table named ShipDate, a one-to-many relationship from Date[date_id] to Sales[sales_date_id], and a one-to-many relationship from ShipDate[date_id] to Sales[sales_skip_date_id]
Question 5:
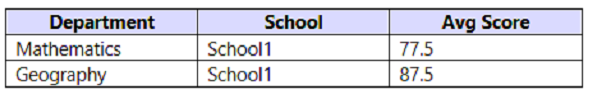
You are building a data model for a Power BI report.
You have data formatted as shown in the following table.
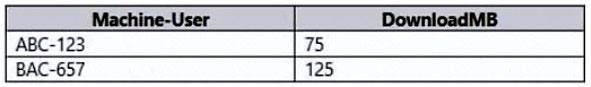
You need to create a clustered bar chart as shown in the following exhibit.
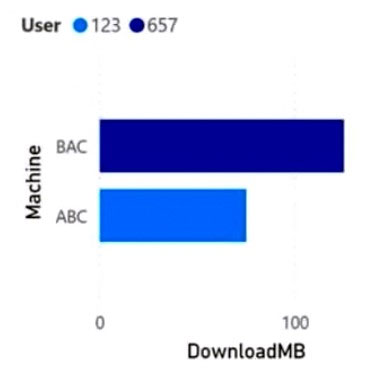
What should you do?
A.
From Power Query Editor, split the Machine-User column by using a delimiter.
B.
From Power Query Editor, create a column that contains the last three digits of the Machine-User column.
C.
In a DAX function, create two calculated columns named Machine and User by using the SUBSTITUTE function.
D.
In a DAX function, create two measures named Machine and User by using the SUBSTITUTE function.
Question 6:
You have a CSV file that contains user complaints. The file contains a column named Logged. Logged contains the date and time each complaint occurred. The data in Logged is in the following format: 2018-12-31 at 08:59.
You need to be able to analyze the complaints by the logged date and use a built-in date hierarchy.
What should you do?
A.
Apply a transformation to extract the last 11 characters of the Logged column and set the data type of the new column to Date.
B.
Change the data type of the Logged column to Date.
C.
Split the Logged column by using at as the delimiter.
D.
Apply the Parse function from the Date transformations options to the Logged column.
Question 7:
You are building a Power BI report to analyze customer segments.
You need to identify customer segments dynamically based on the Bounce Rate across dimensions such as source, geography, and demographics. The solution must minimize analysis effort.
Which type of visualization should you use?
A.
decomposition tree
B.
funnel chart
C.
Q&A
D.
key influencers
Question 8:
You are creating a query to be used as a Country dimension in a star schema.
A snapshot of the source data is shown in the following table.
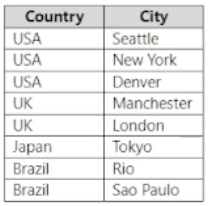
You need to create the dimension. The dimension must contain a list of unique countries.
Which two actions should you perform? Each correct answer presents part of the solution.
NOTE: Each correct selection is worth one point.
A.
Delete the Country column.
B.
Remove duplicates from the table.
C.
Remove duplicates from the City column.
D.
Delete the City column.
E.
Remove duplicates from the Country column.
Question 9:
You use Power Query Editor to preview a query that contains sales order data in the following columns:
• Tax Amount
• Sales Order ID
• Freight Amount
• Subtotal Amount
• Total Item Quantity
The Sales Order ID column uniquely identifies each sales order. The Subtotal Amount and Total Item Quantity columns are always populated, but the Tax Amount and Freight Amount columns are sometimes null when an order has no associated amount.
You need to query the data to identify the following metrics by month:
• The average item quantity per order
• The average freight amount per order
• The maximum item quantity per order
How should you modify the query?
A.
In the Total Item Quantity column, replace the null values with 0.
B.
In the Tax Amount column, remove rows that contain null values.
C.
In the Freight Amount column, remove rows that contain null values.
D.
In the Freight Amount column, replace the null values with 0.
Question 10:
HOTSPOT -
You have a column named UnitsInStock as shown in the following exhibit.
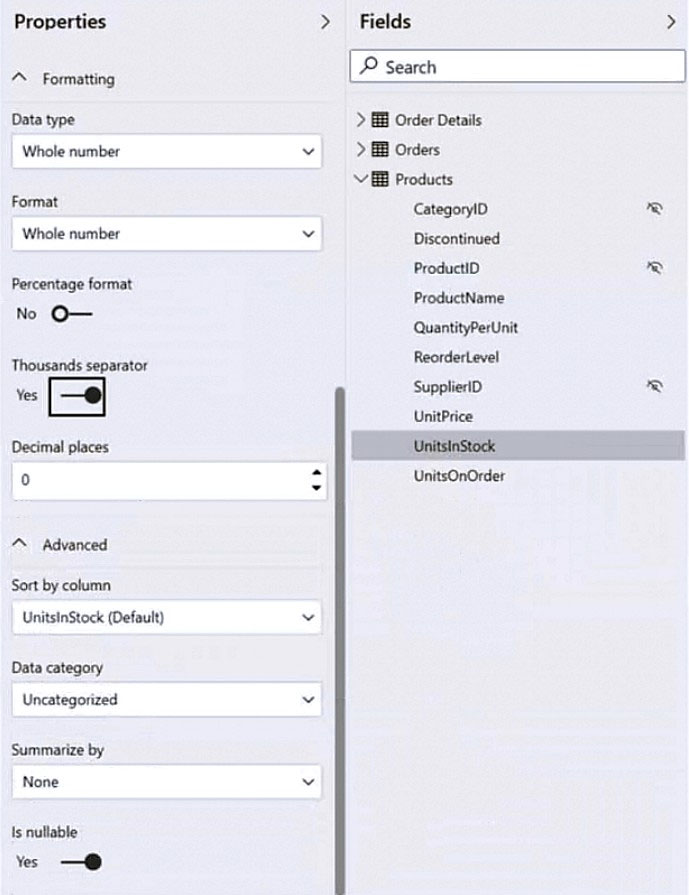
UnitsInStock has 75 non-null values, of which 51 are unique.
Use the drop-down menus to select the answer choice that completes each statement based on the information presented in the graphic.
NOTE: Each correct selection is worth one point.
Hot Area:
Question 11:
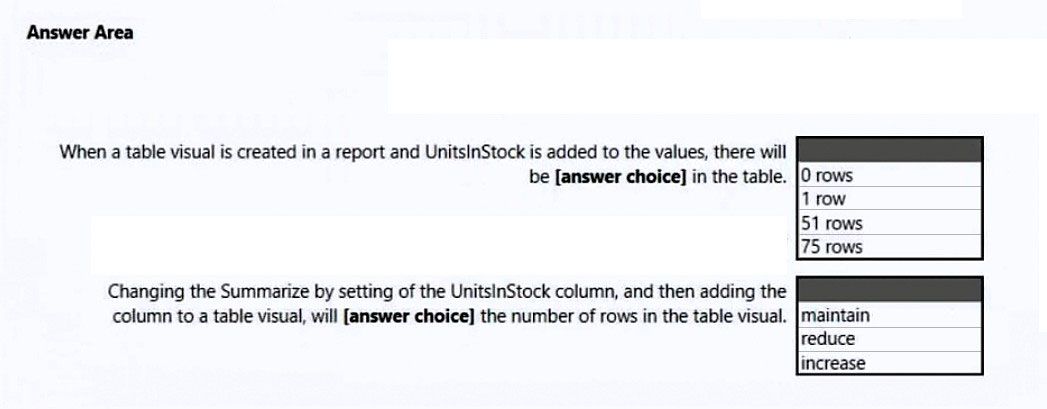
HOTSPOT -
You need to create a measure that returns the percent of revenue by product category.
How should you complete the measure? To answer, select the appropriate options in the answer area.
NOTE: Each correct selection is worth one point.
Hot Area:
Question 12:
You need to configure access for the sales department users. The solution must the meet the security requirements.
What should you do?
A.
Share each report to the Azure Active Directory group of the sales department.
B.
Add the Azure Active Directory group of the sales department as an Admin of the reports workspace.
C.
Distribute an app to the users in the Azure Active Directory group of the sales department.
D.
Add the sales department as a member of the reports workspace.
Question 13:
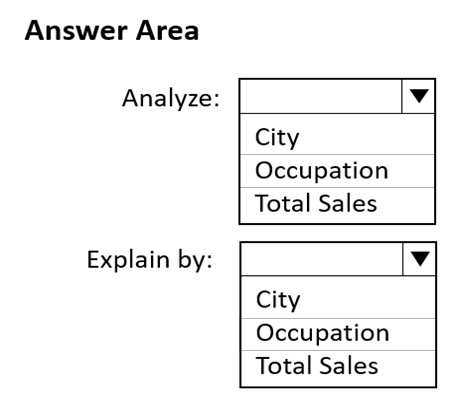
HOTSPOT -
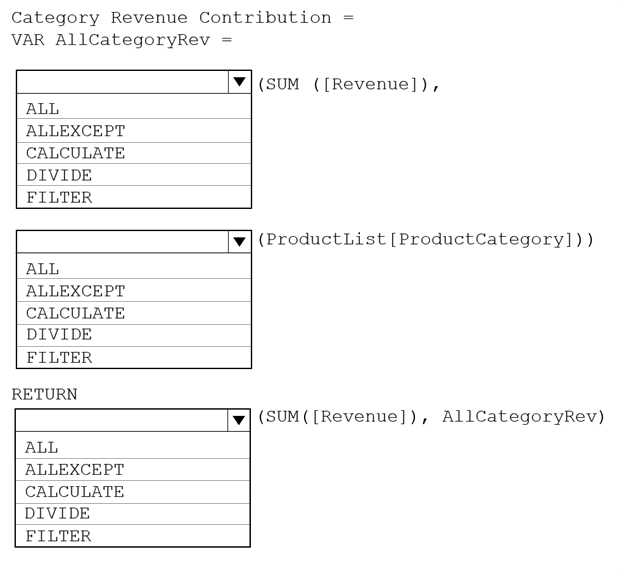
You have a table that contains the following three columns:
City -

✑ Total Sales
✑ Occupation
You need to create a key influencers visualization as shown in the exhibit. (Click the Exhibit tab.)
How should you configure the visualization? To answer, select the appropriate options in the answer area.
NOTE: Each correct selection is worth one point.
Hot Area:
Question 14:
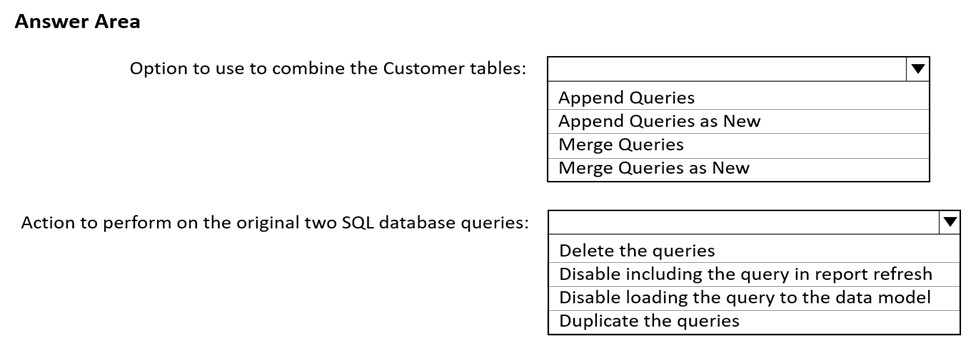
HOTSPOT -
You have two Azure SQL databases that contain the same tables and columns.
For each database, you create a query that retrieves data from a table named Customer.
You need to combine the Customer tables into a single table. The solution must minimize the size of the data model and support scheduled refresh in powerbi.com.
What should you do? To answer, select the appropriate options in the answer area.
NOTE: Each correct selection is worth one point.
Hot Area:
Question 15:
You have a dataset that is used infrequently and refreshes every hour.
You receive a notification that the refresh was disabled due to inactivity.
Which two actions will cause the scheduled refresh schedule to resume? Each correct answer presents a complete solution.
NOTE: Each correct selection is worth one point.
A.
Enable query caching for the dataset.
B.
Import the dataset to Microsoft Excel.
C.
From the Power BI service, open a dashboard that uses the dataset.
D.
From the Power BI service, open a report that uses the dataset.
E.
From PowerShell, run the get-powerbireport cmdlet.
Question 16:
You have a PBIX file that imports several tables from an Azure SQL database.
The data will be migrated to another Azure SQL database.
You need to change the connections in the PBIX file. The solution must minimize administrative effort.
What should you do?
A.
From Power Query Editor, create new queries.
B.
From Power Query Editor, modify the source of each query.
C.
Create a PBIT file, open the file, and change the data sources when prompted.
D.
Modify the Data source settings.
Question 17:
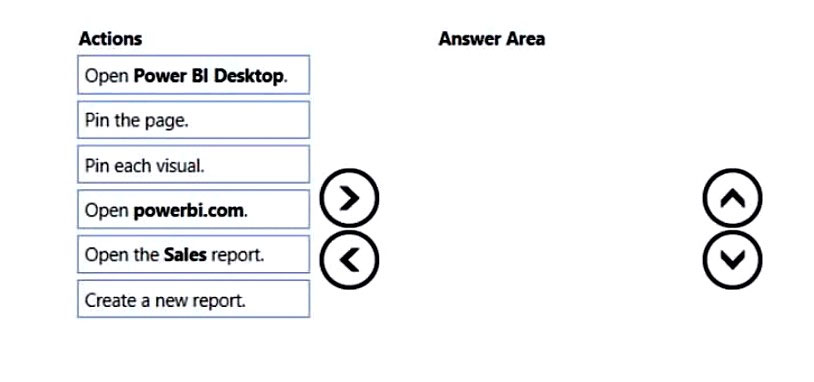
DRAG DROP -
You have a Power BI workspace that contains a single-page report named Sales.
You need to add all the visuals from Sales to a dashboard. The solution must ensure that additional visuals added to the page are added automatically to the dashboard.
Which three actions should you perform in sequence? To answer, move the appropriate actions from the list of actions to the answer area and arrange them in the correct order.
Select and Place:
Question 18:
You have a CSV file that contains user complaints. The file contains a column named Logged. Logged contains the date and time each complaint occurred. The data in Logged is in the following format: 2018-12-31 at 08:59.
You need to be able to analyze the complaints by the logged date and use a built-in date hierarchy.
What should you do?
A.
Apply a transformation to extract the first 11 characters of the logged column.
B.
Add a conditional column that outputs 2018 if the Logged column starts with 2018 and set the data type of the new column to Whole Number.
C.
Create a column by example that starts with 2018-12-31 and set the data type of the new column to Date.
D.
Apply a transformation to extract the last 11 characters of the Logged column and set the data type of the new column to Date.
Question 19:
You have a Power BI report. The report contains a line chart that displays sales data for several regions.
You need to add an element to the report that will enable users to filter the sales data to include only a selected region.
Which two elements achieve the goal? Each correct answer presents a complete solution.
NOTE: Each correct selection is worth one point.
A.
a slicer visual
B.
a drillthrough filter
C.
a table visual
D.
a card visual
E.
a Key Performance Indicator (KPI) visual
Question 20:
Note: This question is part of a series of questions that present the same scenario. Each question in the series contains a unique solution that might meet the stated goals. Some question sets might have more than one correct solution, while others might not have a correct solution.
After you answer a question in this section, you will NOT be able to return to it. As a result, these questions will not appear in the review screen.
You are modeling data by using Microsoft Power BI. Part of the data model is a large Microsoft SQL Server table named Order that has more than 100 million records.
During the development process, you need to import a sample of the data from the Order table.
Solution: From Power Query Editor, you import the table and then add a filter step to the query.
Does this meet the goal?
A.
Yes
B.
No
Question 21:
Note: This question is part of a series of questions that present the same scenario. Each question in the series contains a unique solution that might meet the stated goals. Some question sets might have more than one correct solution, while others might not have a correct solution.
After you answer a question in this section, you will NOT be able to return to it. As a result, these questions will not appear in the review screen.
You are modeling data by using Microsoft Power BI. Part of the data model is a large Microsoft SQL Server table named Order that has more than 100 million records.
During the development process, you need to import a sample of the data from the Order table.
Solution: You add a WHERE clause to the SQL statement.
Does this meet the goal?
A.
Yes
B.
No
Question 22:
You have a Microsoft Power BI data model that contains three tables named Orders, Date, and City. There is a one-to-many relationship between Date and
Orders and between City and Orders.
The model contains two row-level security (RLS) roles named Role1 and Role2. Role1 contains the following filter.
City[State Province] = "Kentucky"
Role2 contains the following filter.
Date[Calendar Year] = 2020 -
If a user is a member of both Role1 and Role2, what data will they see in a report that uses the model?
A.
The user will see data for which the State Province value is Kentucky or where the Calendar Year is 2020.
B.
The user will receive an error and will not be able to see the data in the report.
C.
The user will only see data for which the State Province value is Kentucky.
D.
The user will only see data for which the State Province value is Kentucky and the Calendar Year is 2020.
Question 23:
Note: This question is part of a series of questions that present the same scenario. Each question in the series contains a unique solution that might meet the stated goals. Some question sets might have more than one correct solution, while others might not have a correct solution.
After you answer a question in this section, you will NOT be able to return to it. As a result, these questions will not appear in the review screen.
You are modeling data by using Microsoft Power BI. Part of the data model is a large Microsoft SQL Server table named Order that has more than 100 million records.
During the development process, you need to import a sample of the data from the Order table.
Solution: You write a DAX expression that uses the FILTER function.
Does this meet the goal?
A.
Yes
B.
No
Question 24:
Note: This question is part of a series of questions that present the same scenario. Each question in the series contains a unique solution that might meet the stated goals. Some question sets might have more than one correct solution, while others might not have a correct solution.
After you answer a question in this section, you will NOT be able to return to it. As a result, these questions will not appear in the review screen.
You are modeling data by using Microsoft Power BI. Part of the data model is a large Microsoft SQL Server table named Order that has more than 100 million records.
During the development process, you need to import a sample of the data from the Order table.
Solution: You add a report-level filter that filters based on the order date.
Does this meet the goal?
A.
Yes
B.
No
Question 25:
You are creating a sales report in Power BI for the NorthWest region sales territory of your company. Data will come from a view in a Microsoft SQL Server database. A sample of the data is shown in the following table:
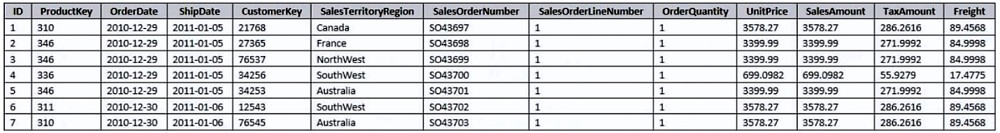
The report will facilitate the following analysis:
✑ The count of orders and the sum of total sales by Order Date
✑ The count of customers who placed an order
✑ The average quantity per order
You need to reduce data refresh times and report query times.
Which two actions should you perform? Each correct answer presents part of the solution.
NOTE: Each correct selection is worth one point.
A.
Set the data type for SalesOrderNumber to Decimal Number.
B.
Remove the CustomerKey and ProductKey columns.
C.
Remove the TaxAmt and Freight columns.
D.
Filter the data to only the NorthWest region sales territory.
Question 26:
You have a Power BI data model that contains a table named Employees. The table has the following columns:
• Employee Name
• Email Address
• Start Date
• Job Title
You are implementing dynamic row-level security (RLS).
You need to create a table filter to meet the following requirements:
• Users must see only their own employee data.
• The DAX expression must work in both Power BI Desktop and the Power BI service.
Which expression should you use?
A.
[Email Address] - USERNAME()
B.
[Employee Name] - USERPRINCIPALNAME()
C.
[Employee Name] = USERNAME()
D.
[Email Address] = USERPRINCIPALNAME()
Question 27:
You import a Power BI dataset that contains the following tables:
✑ Date
✑ Product
✑ Product Inventory
The Product Inventory table contains 25 million rows. A sample of the data is shown in the following table.
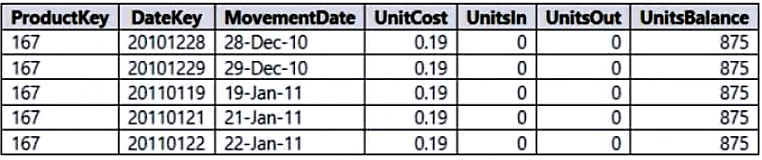
The Product Inventory table relates to the Date table by using the DateKey column. The Product Inventory table relates to the Product table by using the
ProductKey column.
You need to reduce the size of the data model without losing information.
What should you do?
A.
Change Summarization for DateKey to Don't Summarize.
B.
Remove the relationship between Date and Product Inventory
C.
Change the data type of UnitCost to Integer.
D.
Remove MovementDate.
Question 28:
You have a Power BI model that contains a table named Employees. The table contains the following columns:
• Employee ID
• First Name
• Last Name
• Department
• Salary
Each employee is uniquely identified by using Employee ID.
You need to create a DAX measure that will calculate the average salary of all the employees in the sales department.
Which DAX expression should you use?
A.
DISTINCTCOUNT(‘Employees’[Salary])
B.
CALCULATE(DISTINCTCOUNT(‘Employees’[Salary]), ‘Employees’[Department] = “Sales”)
C.
CALCULATE(AVERAGE(‘Employees’[Salary]), ‘Employees’[Department] = “Sales”)
D.
AVERAGE(‘Employees’[Salary])
Question 29:
You have the Power BI model shown in the following exhibit.
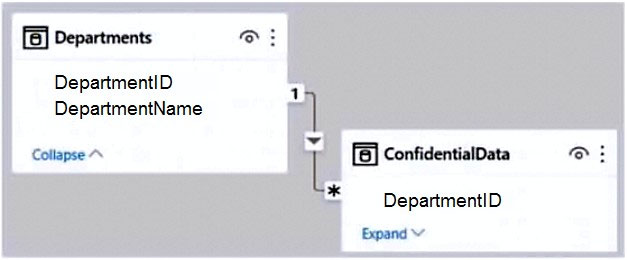
There are four departments in the Departments table.
You need to ensure that users can see the data of their respective department only.
What should you do?
A.
Create a slicer that filters Departments based on DepartmentID.
B.
Create a row-level security (RLS) role for each department, and then define the membership of the role.
C.
Create a DepartmentID parameter to filter the Departments table.
D.
To the ConfidentialData table, add a calculated measure that uses the CURRENTGROUP DAX function.
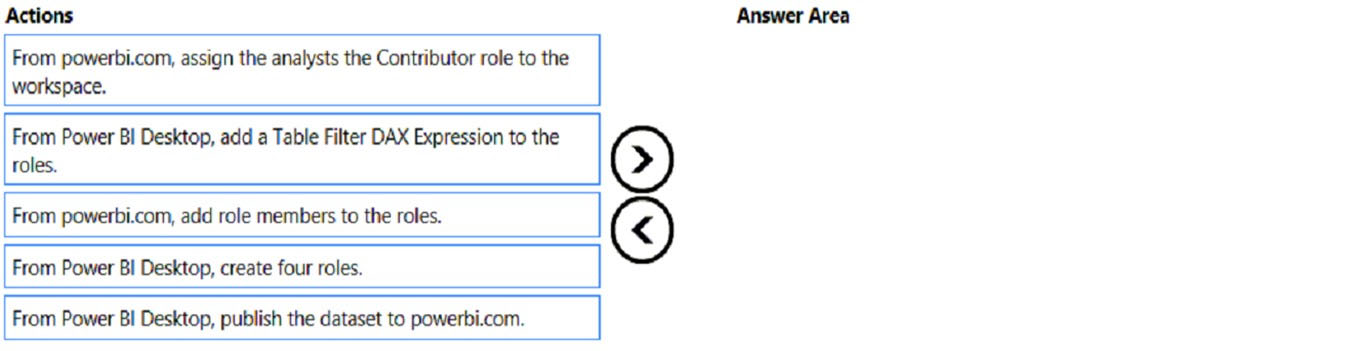
Question 30:
DRAG DROP -
Once the profit and loss dataset is created, which four actions should you perform in sequence to ensure that the business unit analysts see the appropriate profit and loss data? To answer, move the appropriate actions from the list of actions to the answer area and arrange them in the correct order.
Select and Place:
Question 31:
DRAG DROP -
You have a Microsoft Excel workbook that contains two sheets named Sheet1 and Sheet2.
Sheet1 contains the following table named Table1.
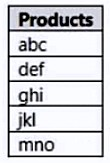
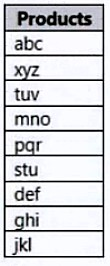
Sheet2 contains the following table named Table2.
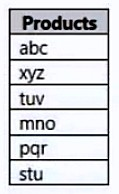
You need to use Power Query Editor to combine the products from Table1 and Table2 into the following table that has one column containing no duplicate values.
Which three actions should you perform in sequence? To answer, move the appropriate actions from the list of actions to the answer area and arrange them in the correct order.
Select and Place:
Question 32:
DRAG DROP -
You have a Microsoft Excel spreadsheet that contains the data shown in the following table.
You plan to build a data model for a Power BI report.
You need to prepare the data so that it is available to the model in the format shown in the following table.
Which three actions should you perform in sequence in Power Query Editor? To answer, move the appropriate actions from the list of actions to the answer area and arrange them in the correct order.
Select and Place:
Question 33:
You have a report that contains a bar chart and a column chart. The bar chart shows customer count by customer segment. The column chart shows sales by month.
You need to ensure that when a segment is selected in the bar chart, you see which portion of the total sales for the month belongs to the customer segment.
How should the visual interactions be set on the column chart when the bar chart is selected?
A.
highlight
B.
filter
C.
no impact
Question 34:
You need to design the data model to meet the report requirements.
What should you do in Power BI Desktop?
A.
From Power Query, add a date table. Create an active relationship to the OrderDate column in the Orders table and an inactive relationship to the ShippedDate column in the Orders table.
B.
From Power Query, add columns to the Orders table to calculate the calendar quarter and the calendar month of the OrderDate column.
C.
From Power BI Desktop, use the Auto date/time option when creating the reports.
D.
From Power Query, use a DAX expression to add columns to the Orders table to calculate the calendar quarter of the OrderDate column, the calendar month of the OrderDate column, the calendar quarter of the ShippedDate column, and the calendar month of the ShippedDate column.
Question 35:
Note: This question is part of a series of questions that present the same scenario. Each question in the series contains a unique solution that might meet the stated goals. Some question sets might have more than one correct solution, while others might not have a correct solution.
After you answer a question in this section, you will NOT be able to return to it. As a result, these questions will not appear in the review screen.
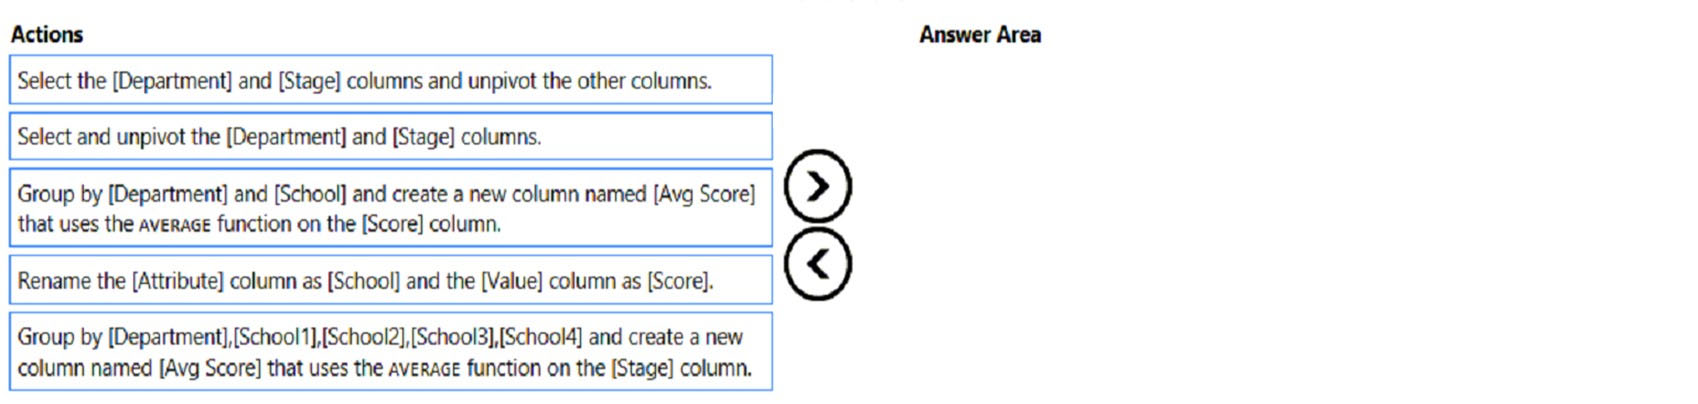
From Power Query Editor, you profile the data shown in the following exhibit.
The IoT GUID and IoT ID columns are unique to each row in the query.
You need to analyze IoT events by the hour and day of the year. The solution must improve dataset performance.
Solution: You remove the IoT GUID column and retain the IoT ID column.
Does this meet the goal?
A.
Yes
B.
No
Question 36:
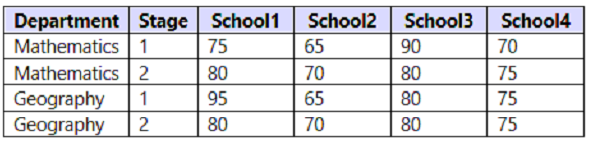
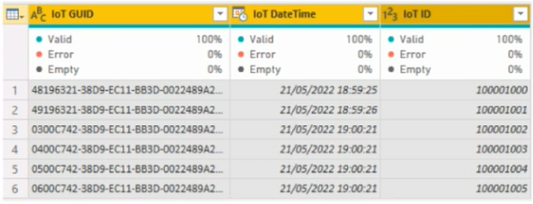
You have the tables shown in the following table.
The Impressions table contains approximately 30 million records per month.
You need to create an ad analytics system to meet the following requirements:
✑ Present ad impression counts for the day, campaign, and site_name. The analytics for the last year are required.
Minimize the data model size.

Which two actions should you perform? Each correct answer presents part of the solution.
NOTE: Each correct selection is worth one point.
A.
Create one-to-many relationships between the tables.
B.
Group the Impressions query in Power Query by Ad_id, Site_name, and Impression_date. Aggregate by using the CountRows function.
C.
Create a calculated table that contains Ad_id, Site_name, and Impression_date.
D.
Create a calculated measure that aggregates by using the COUNTROWS function.
Question 37:
DRAG DROP -
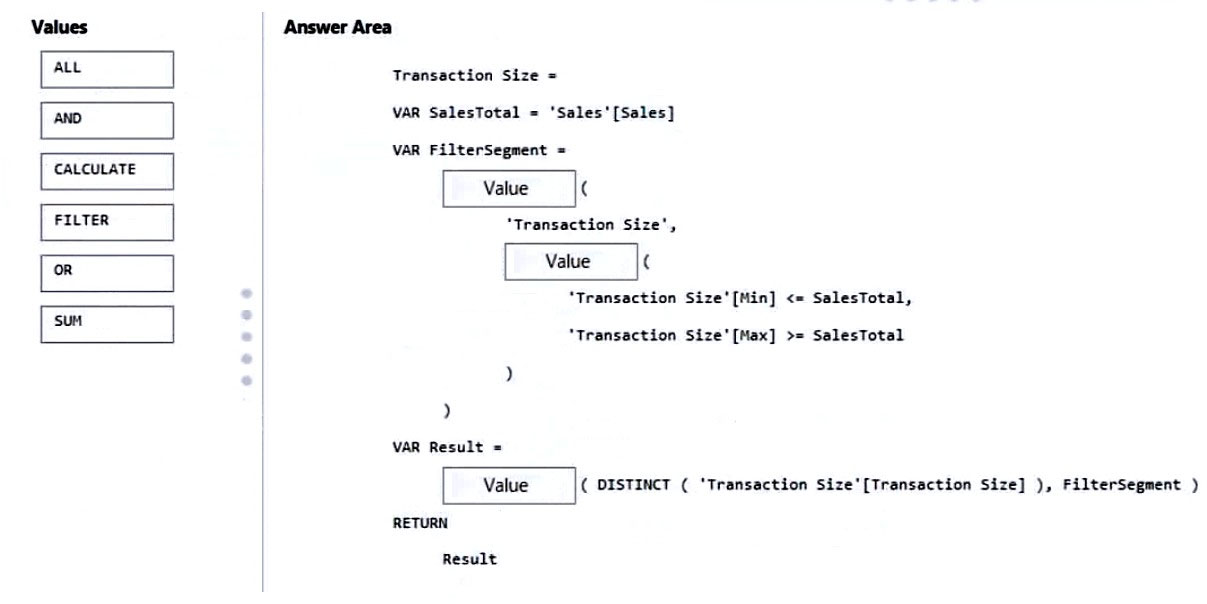
You are modifying a Power BI model by using Power BI Desktop.
You have a table named Sales that contains the following fields.
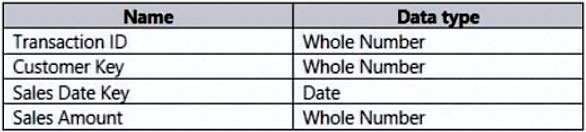
You have a table named Transaction Size that contains the following data.
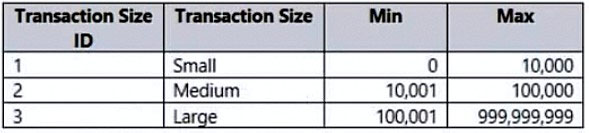
You need to create a calculated column to classify each transaction as small, medium, or large based on the value in Sales Amount.
How should you complete the code? To answer, drag the appropriate values to the correct targets. Each value may be used once, more than once, or not at all.
You may need to drag the split bar between panes or scroll to view content.
NOTE: Each correct selection is worth one point.
Select and Place:
Question 38:
Note: This question is part of a series of questions that present the same scenario. Each question in the series contains a unique solution that might meet the stated goals. Some question sets might have more than one correct solution, while others might not have a correct solution.
After you answer a question in this section, you will NOT be able to return to it. As a result, these questions will not appear in the review screen.
You have a Power BI report that imports a date table and a sales table from an Azure SQL database data source. The sales table has the following date foreign keys:
• Due Date
• Order Date
• Delivery Date
You need to support the analysis of sales over time based on all three dates at the same time.
Solution: From the Fields pane, you rename the date table as Due Date. You use a DAX expression to create Order Date and Delivery Date as calculated tables. You create active relationships between the sales table and each date table.
Does this meet the goal?
A.
Yes
B.
No
Question 39:
HOTSPOT -
You need to create the Top Customers report.
Which type of filter should you use, and at which level should you apply the filter? To answer, select the appropriate options in the answer area.
NOTE: Each correct selection is worth one point.
Hot Area:

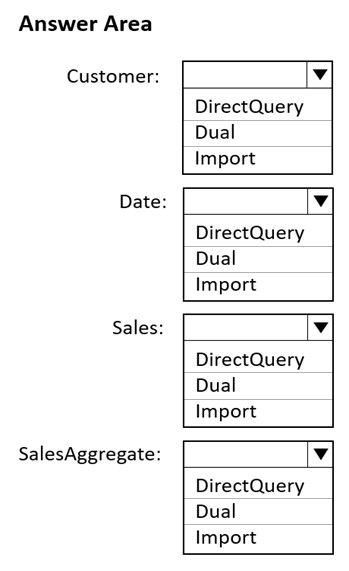
Question 40:
HOTSPOT -
You plan to create the Power BI model shown in the exhibit. (Click the Exhibit tab.)
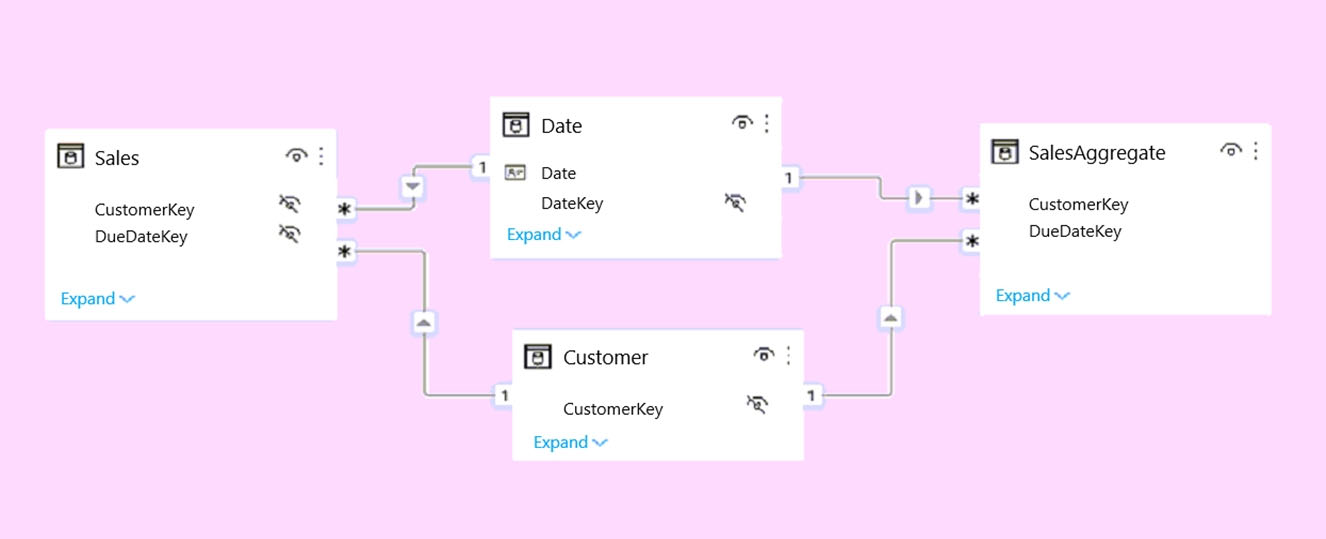
The data has the following refresh requirements:
✑ Customer must be refreshed daily.
✑ Date must be refreshed once every three years.
✑ Sales must be refreshed in near real time.
✑ SalesAggregate must be refreshed once per week.
You need to select the storage modes for the tables. The solution must meet the following requirements:
✑ Minimize the load times of visuals.
✑ Ensure that the data is loaded to the model based on the refresh requirements.
Which storage mode should you select for each table? To answer, select the appropriate options in the answer area.
NOTE: Each correct selection is worth one point.
Hot Area:
Question 41:
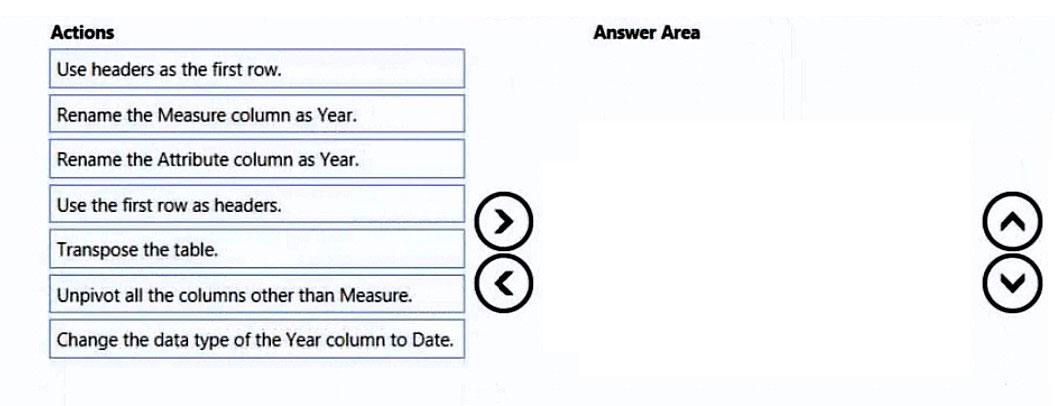
DRAG DROP -
You are preparing a financial report in Power BI.
You connect to the data stored in a Microsoft Excel spreadsheet by using Power Query Editor as shown in the following exhibit.
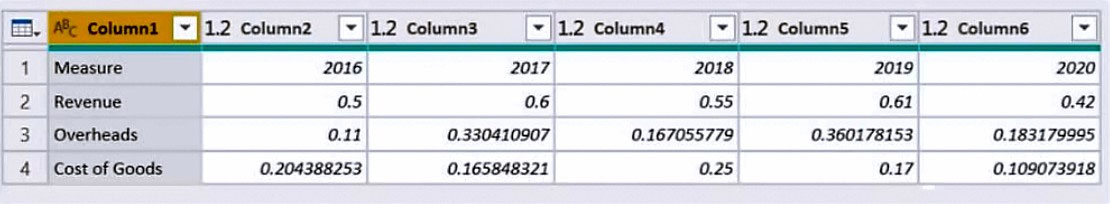
You need to prepare the data to support the following:
✑ Visualizations that include all measures in the data over time
✑ Year-over-year calculations for all the measures
Which four actions should you perform in sequence? To answer, move the appropriate actions from the list of actions to the answer area and arrange them in the correct order.
Select and Place:
Question 42:
You need to create the dataset.
Which dataset mode should you use?
A.
Import
B.
DirectQuery
C.
Composite
D.
live connection
Question 43:
You have five sales regions. Each region is assigned a single salesperson.
You have an imported dataset that has a dynamic row-level security (RLS) role named Sales. The Sales role filters sales transaction data by salesperson.
Salespeople must see only the data from their region.
You publish the dataset to powerbi.com, set RLS role membership, and distribute the dataset and related reports to the salespeople.
A salesperson reports that she believes she should see more data.
You need to verify what data the salesperson currently sees.
What should you do?
A.
Use the Test as role option to view data as the salesperson's user account.
B.
Use the Test as role option to view data as the Sales role.
C.
Instruct the salesperson to open the report in Microsoft Power BI Desktop.
D.
Filter the data in the reports to match the intended logic in the filter on the sales transaction table.
Question 44:
You have a collection of reports for the HR department of your company.
You need to create a visualization for the HR department that shows historical employee counts and predicts trends during the next six months.
Which type of visualization should you use?
A.
ribbon chart
B.
scatter chart
C.
line chart
D.
key influencers
Question 45:
For the sales department at your company, you publish a Power BI report that imports data from a Microsoft Excel file located in a Microsoft SharePoint folder.
The data model contains several measures.
You need to create a Power BI report from the existing data. The solution must minimize development effort.
Which type of data source should you use?
A.
Power BI dataset
B.
a SharePoint folder
C.
Power BI dataflows
D.
an Excel workbook
Question 46:
You have a Power BI model that contains two tables named Population and Date.
The Population table contains two columns named PopulationAmount and DateKey.
DateKey contains date values that represent the first day of a year and are used to create a many-to-one relationship with the Date table.
The Power BI model contains two measures that have the following definitions.
Total Population = Sum(‘Population’[PopulationAmount])
2023 Population = CALCULATE([Total Population], ‘Date'[Year] = 2023)
You create a table visual that displays Date[Year] and [2023 Population].
What will the table visual show?
A.
one row per year that contains blank values for every year except 2023
B.
one row per date that contains the population value for the corresponding year repeated in each row
C.
a single row for the year 2023 that contains the related population value
D.
one row per year that contains the same value repeated for each year
Question 47:
You have a Power BI query named Sales that imports the columns shown in the following table.
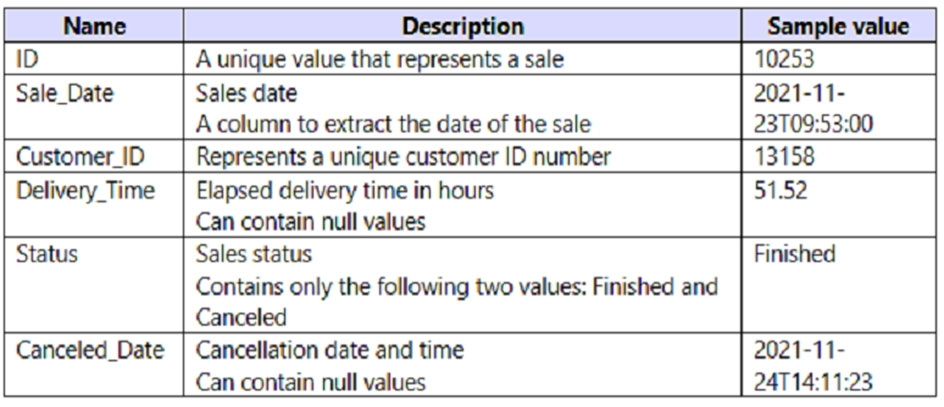
Users only use the date part of the Sales_Date field. Only rows with a Status of Finished are used in analysis.
You need to reduce the load times of the query without affecting the analysis.
Which two actions achieve this goal? Each correct answer presents a complete solution.
NOTE: Each correct selection is worth one point.
A.
Remove the rows in which Sales[Status] has a value of Canceled.
B.
Remove Sales[Sales_Date].
C.
Change the data type of Sale[Delivery_Time] to Integer.
D.
Split Sales[Sale_Date] into separate date and time columns.
E.
Remove Sales[Canceled Date].
Question 48:
You have a custom connector that returns ID, From, To, Subject, Body, and Has Attachments for every email sent during the past year. More than 10 million records are returned.
You build a report analyzing the internal networks of employees based on whom they send emails to.
You need to prevent report recipients from reading the analyzed emails. The solution must minimize the model size.
What should you do?
A.
From Model view, set the Subject and Body columns to Hidden.
B.
Remove the Subject and Body columns during the import.
C.
Implement row-level security (RLS) so that the report recipients can only see results based on the emails they sent.
Question 49:
You build a report to analyze customer transactions from a database that contains the tables shown in the following table.
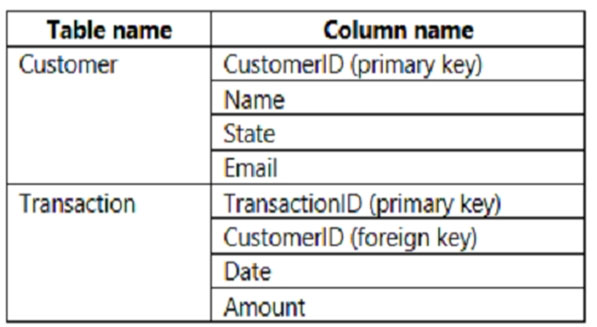
You import the tables.
Which relationship should you use to link the tables?
A.
one-to-many from Transaction to Customer
B.
one-to-one between Customer and Transaction
C.
many-to-many between Customer and Transaction
D.
one-to-many from Customer to Transaction
Question 50:
Note: This question is part of a series of questions that present the same scenario. Each question in the series contains a unique solution that might meet the stated goals. Some question sets might have more than one correct solution, while others might not have a correct solution.
After you answer a question in this section, you will NOT be able to return to it. As a result, these questions will not appear in the review screen.
You have a Power BI report that imports a date table and a sales table from an Azure SQL database data source. The sales table has the following date foreign keys:
✑ Due Date
✑ Order Date
✑ Delivery Date
You need to support the analysis of sales over time based on all the date foreign keys.
Solution: From the Fields pane, you rename the date table as Due Date. You use a DAX expression to create Order Date and Delivery Date as calculated tables.
Does this meet the goal?
A.
Yes
B.
No
Disclaimer:
The content on this webpage is collected from various internet sources. While we strive for accuracy, we cannot guarantee its completeness or correctness. Please use it with caution and conduct further research if needed. We do not claim ownership or copyright over any content. If you find any copyrighted material or content that violates laws, please contact us for removal. By accessing this webpage, you agree to these terms. Thank you for your understanding.
The content on this webpage is collected from various internet sources. While we strive for accuracy, we cannot guarantee its completeness or correctness. Please use it with caution and conduct further research if needed. We do not claim ownership or copyright over any content. If you find any copyrighted material or content that violates laws, please contact us for removal. By accessing this webpage, you agree to these terms. Thank you for your understanding.